Quantcast
Channel: Infragistics Community
Viewing all 2374 articles
Browse latest View live

Quick-Tip: Creating Grid Lines on the IGGridView (Objective-C)

$
0
0

Introduction

As of NucliOS 2013 Volume 1, the IGGridView currently does not support column separator lines. Until we add this feature natively, there's a simple workaround you can use to create gridlines.

Introduction

Creating the Gridlines

The idea of the work around consists of using the IGGridView'sbackgroundColor in combination with the columnSpacing and rowSeparatorHeight properties to create a separation between the cells as shown in the above illustration.

UIColor *gridlineColor = [UIColor blackColor];
CGFloat gridlineSeparation = 2.0;
_gridView.backgroundColor = gridlineColor;
_gridView.columnSpacing = gridlineSeparation;
_gridView.rowSeparatorHeight = gridlineSeparation;
_gridView.rowSeparatorColor = gridlineColor;
_gridView.rowHeight = 50;


Using this work around doesn't require the IGGridView to stay in any generic design, you can still take advantage of the great layout functionality. The image below demonstrates this work around on an Excel-like grid.

Creating the Gridlines

Download the Example Project

The Xcode project source code for this quick tip can be downloaded by clicking this link. You will need to add the IG.framework to the Xcode project after you install the NucliOS trial.

A much easier to read format of this post is available here.

By Torrey Betts


Code School – HTML5 Resource of the Day

$
0
0

I’m currently going through a bit of a learning process trying to get up to speed with the web world and HTML5. As someone who has dedicated most of my time the past few years on desktop and mobile platform development, there’s a lot to learn. Not only do I need to get the basics under my belt, but I also have to keep up with new things that seem to come out every day. It is a lot to keep track of and I’ve been developing a list of things that can help the process along. I want to share those with you so that we can all benefit from whatever I pick up during the process. The first resource I want to share with you is Code School.

Code School - Learn by doing

Code School is an amazing resource for learning new programming skills. They currently have courses that cover Ruby, JavaScript, HTML/CSS, and iOS as well as some assorted topics they call Electives.

Code School has a unique learning experience that couples high quality video content with step-by-step coding challenges that you complete in the browser. This is truly learning by doing. Each course is broken up into levels and you receive an achievement for completing each level.

The video production quality for the lessons are top-notch. The instructor will often appear alongside the slide material. Here’s an example screenshot from the Try jQuery course:

video-th

The coding challenges tie directly into the material that was presented for the lesson and walk you through the concepts. Each challenge will be a simple task and you will receive immediate results for each mini challenge. If you get the challenge incorrect, they will help guide you based on what exactly was incorrect in your answer. It is a very smart system that can catch common mistakes. This is a great way to learn. If you are stuck, they offer a few hints for each challenge as well. Here’s a screenshot from the “Traversing the DOM” section of the Try jQuery course:

challenge-th

Summary

Code School is a great way to learn and they have free courses to get you started. I would highly recommend checking out the Try jQuery course to get a feel for how this process works. For me, it has been the best way to learn jQuery. I look forward to trying some of their other courses soon.

Contact

If you have any questions or comments in the meantime, please feel free to email me at bschooley@infragistics.com or find me on Twitter @brentschooley.

What’s in a Name? Job Titles for Software Engineers

$
0
0

What’s in a title?  I guess it depends on whose title you are talking about.  When it comes to job titles, and one’s own, the subject can be quite contentious.  Many employees jealously guard titles, as often they are the only thing available to indicate seniority. Others just want a title that describes what they do.  Some of course don’t really care.

The bigger issue comes when applying for a new job.  There is a such a mix of titles out there that, at first glance, it can be difficult to understand what a job actually is.

When it comes to software engineering (or software development - but we will come to all that in a moment) it seems there is a fairly wide selection of titles out there. Some mean the same thing, some indicate specific skills, and some are just plain silly.

Let's try to make a bit of sense of it all:

  • Software Engineer - In Europe the term Engineer tends to mean people with some kind of engineering qualification or degree.  Used more in the U.S., but it is definitely one of the more well used job titles out there.
  • Developer - Often prefixed with ‘Senior,’ ‘Junior,’ or some form of specialism like ‘.NET.’ This is another stalwart job title to go with Software Engineer.
  • Programmer - Less of a job title, more of a description. This doesn’t tend to be used too much in job description or advertisements. People might describe themselves as one informally.
  • Technical Lead - The term Lead in this one tends to indicate some kind of extra responsibility. But this role could really mean anything, so don’t jump to conclusions.
  • Architect - Job roles with Architect in them tend to be more senior, and tend to look at more overarching implementation and integration issues.  A Developer might write the code for a particular module, but an Architect will design how the various modules fit together.

At the end of the day, does any of this matter?  Hmm… probably not.  As long as individuals are clear on the job role and what it means, that is the main thing.  It would, however, be good to see a little more consistency.  Consistency across the industry is probably a bit much to wish for, but consistency across a single organization would be a good start.

Let us know any strange or over complicated job titles you have come across in the comments below.

Interested in a career here at Infragistics? Check out our current openings!

Top 3 SharePoint Conferences Worldwide in 2013

$
0
0

Conferences are a great way to keep involved in the wider tech community. They offer a chance to meet new people, socialize, and network. They allow attendees to get involved with new product launches, to see demos, and test samples in person. Best of all, they generally offer tutorials and hands on sessions, run by a wide range of experts, showing off the latest techniques.

SharePoint has always been served by a particularly vocal and active community, and this community has over the years hosted many great conferences around the world. Below is a list of three conferences (one in the US, one in Europe, one in Australia) that we think you should consider attending this year. 

While this list is covering some of the more unique SharePoint Conferences, one conference that isn’t listed is the official Microsoft SharePoint conference. This was last held in Las Vegas in 2012. As of yet there are no details of this year’s conference (when or where) but keep an eye on the official site for more information. When it is announced this show is well worth attending, if for no other reason that it is official show of the year.served by a particularly vocal and active community, and this community has over the years hosted many great conferences around the world. Below is a list of three conferences (one in the US, one in Europe, one in Australia) that we think you should consider attending this year.


1. Australian SharePoint Conference

June 11-12 2013, Melbourne, Australia - More info

The fourth annual Australian SharePoint Conference is centered around the theme of ‘Collaboration’. This is an intentional move away from the usual topics of ‘business outcomes’, toward the softer side of SharePoint projects and implementations. The show features a keynote presentation from Dr. Neil Preston entitled, “The psychology of collaborative maturity: How do you know when your team or organization is truly collaborating?”

Register for the show here. Prices are $AUD 875 + VAT


2. IT / Dev Connections

Sept 30 - Oct 4 2013, Las Vegas, United States - More info

The IT / Dev connections show is a long established conference that caters to a wide range of Microsoft products, including SharePoint. The show is so big that anyone attending for just the SharePoint content won’t be disappointed. This year has a great list of speakers already confirmed, including:

  • Dan Holme - Technologies Evangelist and Consultant
  • Scot Hillier - SharePoint MVP
  • Paul Thurrot - Senior Technical Analyst
  • Tony Redmond - Exchange MVP and Senior Contributing Editor to Windows IT Pro


3. SharePoint Connections Amsterdam

November 19-20 2013, Amsterdam, Netherlands - More info

The SharePoint Connections Amsterdam conference is now in its third year. The 2013 show is supported by the ‘Dutch Information Workers Users Group’ (DIWUG) and the SharePoint Community Netherlands’ (SPCNL) which should lend it an additional level of kudos.

The organizers have listened to feedback of the previous shows and this year session content covers a much wider breadth of subject matter than ever before, including SharePoint Online, hybrid deployments, search, and apps.

Pre Register here for 399 EURO + VAT. 


Tuts+ - HTML5 Resource of the Day

$
0
0

Today’s HTML5 resource is Tuts+. Tuts+ is a tutorial site that contains tutorials for a wide variety of subjects, including web development and design. It’s something I’ve been using in conjunction with Code School (yesterday’s resource) to help me get up to speed with the web world.

nettuts

net tuts+

net tuts+ is the web development section of Tuts+. This site contains tutorials, articles, tips, sessions, resources, and videos that teach users of the site new things about web development. The quality of the content here is great. One of the tutorial series I’ve been going through is the Getting into Ember.js tutorial series by Rey Bango.

webdesign tuts+

webdesign tuts+ is the web design equivalent of net tuts+ and offers up the same type of content for designers. This is a great place to learn new tips and tricks and work through some tutorials to hone your web design skills. I’m currently looking forward to reading the tutorial The Best Way to Learn CSS to help me get up to speed on CSS, but there are many more tutorials from beginner to advanced.

Other related tuts+ categories

The psd tuts+ site can help you learn some valuable Photoshop skills if you are a designer. The mobile tuts+ site might be worth checking out if you are developing HTML5 sites for mobile devices as well.

Summary

Tuts+ is a wonderful resource with a wide variety of tutorials and tips. I’ve been using it a lot as I ramp up on web technologies. You’ll find a little bit of everything here for just about any skill set. If you are getting into HTML5, you should check out Ignite UI. Our jQuery controls will get your data-driven application off to a great, and beautiful, start.

Contact

If you have any questions or comments in the meantime, please feel free to email me at bschooley@infragistics.com or find me on Twitter @brentschooley.

HTML5 Weekly - HTML5 Resource of the Day

$
0
0

Ever wish it was easier to keep up to date on all of the new things that are going on in the world of HTML5? Do you hate managing RSS feeds of the news sites and blogs you need to keep track of to stay current? Today’s HTML5 Resource of the Day will help you solve this problem.

emailmockup

HTML5 Weekly

HTML5 Weekly is a newsletter that will help you keep track of everything that has gone on in the HTML5 world while you’ve been busy programming your applications. Once a week, the newsletter will be delivered directly to your email. It includes a “featured” section that contains a few top stories from the week that you will want to read. There will also be a sponsored article from the company that sponsored that particular issue. There are sections for things to read and screencasts to watch. There is also a helpful section that contains job listings.

If you want to see some sample content, check out the latest issue here.

Summary

HTML5 Weekly is a great resource for those of us who are too busy to try to figure out what we should be reading. Delivered once a week, this newsletter makes it easy to ensure you will never miss important articles and screencasts. If working with HTML5, you should definitely check out Ignite UI. Our jQuery controls will get your data-driven application off to a great, and beautiful, start.

Contact

If you have any questions or comments in the meantime, please feel free to email me at bschooley@infragistics.com or find me on Twitter @brentschooley.

Xamarin.iOS Netflix Style Grid

$
0
0

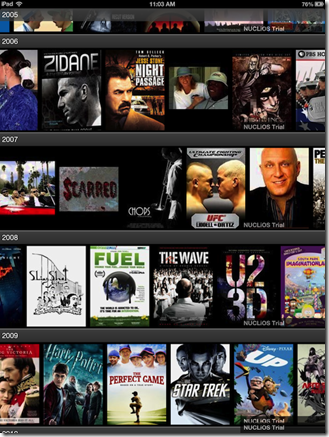
Many people have been requesting more Xamarin.iOS samples for NucliOS. While I haven’t had a chance to work on any of my own recently (those are coming soon), I was happy to see that there are members of our community who have been taking it upon themselves to work on some. Claudio Sanchez has taken SteveZ’s “Creating a Netflix style iOS Grid” blog post and sample and recreated it using Xamarin.iOS.

Please check out Claudio’s work and read his great description on how he translated the sample from Objective-C to C#. There are some good insights to be gained from this work.

6332.IMG_0250

Contact

If you have any questions or comments in the meantime, please feel free to email me at bschooley@infragistics.com or find me on Twitter @brentschooley.

Export dashboard as a deck of PowerPoint slides with ReportPlus

$
0
0

So you’ve designed your first ReportPlus dashboard, congratulations!! Now you want to share it, right? Well, you have a number of options with ReportPlus:

  • Save the dashboard in a shared location, for other ReportPlus users to open it. This shared location can be a SharePoint document library, a Dropbox account, or a Google Drive folder.
  • Email the dashboard. For other ReportPlus users to open.
  • Email a screen capture. Send by email a picture of the dashboard, to share the dashboard with anyone, not just ReportPlus users.
  • Export the dashboard as a PowerPoint file. This is the option we are going to cover in some detail in this article.

ReportPlus Mobile Dashboard

Selecting what to export

By tapping the Export option in the actions popover a wizard that will guide us through the export process is displayed.

If the dashboard has page filters defined the first thing we will have to select is what to export, whether the current view of the dashboard, or a selection of pages, meaning an export of the dashboard filtered with the different values a page filter holds. For instance, exporting the HR Dashboard with all pages, will export the values for all the offices: New Jersey, London, etc. If the dashboard has multiple filters the first one will be selected to be used in the export process.

ReportPlus Dashboard Export PPT

If the all pages option is selected then, ReportPlus will automatically walk through the different values of the first pages filter. The export is capped in 50 pages so you must select less than 50 values to export.

Introducing annotations

In the second dialog of the export wizard a table listing the contents to be exported is displayed. 

ReportPlus Dashboard Annotations

At this point we have the option to introduce comments, and select which values are going to be exported by turning on or off the Visible switch.

ReportPlus Annotate Slide

Previewing the generated ppt

By tapping the preview button the generation process runs and the slides are displayed.

ReportPlus Dashboard Annotated

Sharing the slides

The final step in the export process is defining what to do with the generated file. The options are to send the slides to another iOS app, such as Keynote, or emailing the PowerPoint file.

ReportPlus_SendToApp

Wrap up

Well, we've gone through the export feature which enables ReportPlus dashboards to be shared with anyone. Some of ReportPlus users have requested the ability to customize the PowerPoint template used in the export process, and I wanted to point out that this option is available in the Enterprise version as part of the rebranding support. If you want to know more about the Enterprise version, just let us know!


Smashing Magazine - HTML5 Resource of the Day

$
0
0

I can’t say enough about today’s recommended resource for HTML5 developers and designers. Smashing Magazine has simply become a must read for me on a daily basis. The quality of content at the site is some of the best in the industry and spans a variety of topics from programming to design. If that wasn’t enough, they also have print and eBooks available from the site as well as a very active job board. Let’s take a look at what’s available on this great resource.

Articles

The “magazine” portion of Smashing Magazine is where the site gets its name and it is nothing short of smashing in terms of high quality content. The magazine is broken up into the following major sections: Coding, Design, Mobile, Graphics, UX Design, and Wordpress. Each of these sections is further broken down into subsections. For instance, the Coding section is broken down into CSS, HTML, JavaScript, and Techniques.


samplepost

Books

Smashing Magazine has book sets available in both print and eBook form. These are sold either as bundles or individual books. For instance, The UX Bundle is a collection of 10 books on user experience for $42.40, but each individual book such as Navigation & Interaction can be purchased for $4.99. The print books are collections of useful topics that span multiple disciplines and are printed in a high quality color format. These are definitely coffee table caliber books and are worth checking out.

Smashing-book-4

Summary

Smashing Magazine is an amazing resource for people developing and designing in the HTML5 world. The content is second to none and there is a lot of it produced every week across the various disciplines represented on the site. This is definitely a site you will want to visit frequently.

Contact

If you have any questions or comments in the meantime, please feel free to email me at bschooley@infragistics.com or find me on Twitter @brentschooley.

How to Integrate Ignite UI Pivot Grid in ASP.Net MVC Applications

$
0
0

Ignite UI Pivot Grid is a WEB client (HTML5/jQuery/jQuery.UI based ) implementation of the very successful Infragistics Pivot Grid (xamPivotGrid) , well known from XAML platforms like WPF and Silverlight. Pivot Grid is a component that provides the same functionalities like Pivot Table and developers could embed this control in their applications and get pivot table functionalities out of the box.

Introduction

A pivot table is a program tool that allows you to reorganize and summarize selected columns and rows of data in a spreadsheet or database table to obtain a desired report. A pivot table doesn't actually change the spreadsheet or database itself.

The term pivot table is a generic phrase used by multiple vendors. In the United States, Microsoft Corporation has trademarked the specific form PivotTable. Pivot tables can be seen as a simplification of the more complete and complex OLAP concepts.

On-Line Analytical Processing (OLAP) is a category of software technology that enables analysts, managers and executives to gain insight into data through fast, consistent, interactive access to a wide variety of possible views of information that has been transformed from raw data to reflect the real dimensionality of the enterprise as understood by the user.
OLAP functionality is characterized by dynamic, multi-dimensional analysis of consolidated enterprise data supporting end user analytical and navigational activities including:

  • calculations and modeling applied across dimensions, through hierarchies and/or across members
  • trend analysis over sequential time periods
  • slicing subsets for on-screen viewing
  • drill-down to deeper levels of consolidation
  • reach-through to underlying detail data
  • rotation to new dimensional comparisons in the viewing area

Microsoft SQL Server Analysis Services (SSAS) delivers online analytical processing (OLAP) and data mining functionality for business intelligence applications. Analysis Services supports OLAP by letting you design, create, and manage multidimensional structures that contain data aggregated from other data sources, such as relational databases.


XMLA

XML for Analysis (XMLA) is a SOAP-based XML protocol, designed specifically for universal data access to any standard multidimensional data source that can be accessed over an HTTP connection. Analysis Services uses XMLA as its only protocol when communicating with client applications.

As a developer, you can use XMLA to integrate a client application with Analysis Services. Developers can use XMLA to integrate a client application with Analysis Services, without any dependencies on the .NET Framework or COM interfaces. Applications require XMLA and an HTTP connection to Analysis Services.

In this study we will not talk about how to set XMLA http access for SQL Server Analytics Services (SASS).

You could learn how to set up an SQL server that provides analysis services and XMLA HTTP Access from the great article “How to set up XMLA HTTP Access for SQL Server Analysis Service 2008 and access the Adventure Works 2008 from an Infragistics PivotGrid application”.


XMLA and Ignite UI Pivot Grid

Pivot Grid to use XMLA via Infragistics Data Source (igDataSource) using serverUrl option

There are two main options:

  • Direct XMLA provider via SQL Server HTTP Access
  • Remote XMLA provider (using XMLA via controller / WEB service)

Often requirements could be to use a different format to transfer data between WEB service and WEB client (for example JSON, which is very popular last years)


In this study we will demonstrate direct and remote XMLA access and also how can implement service with a different format (JSON)


Sample Demo


Sample demo is an ASP.Net MVC 4 project, generated with Visual Studio 2012

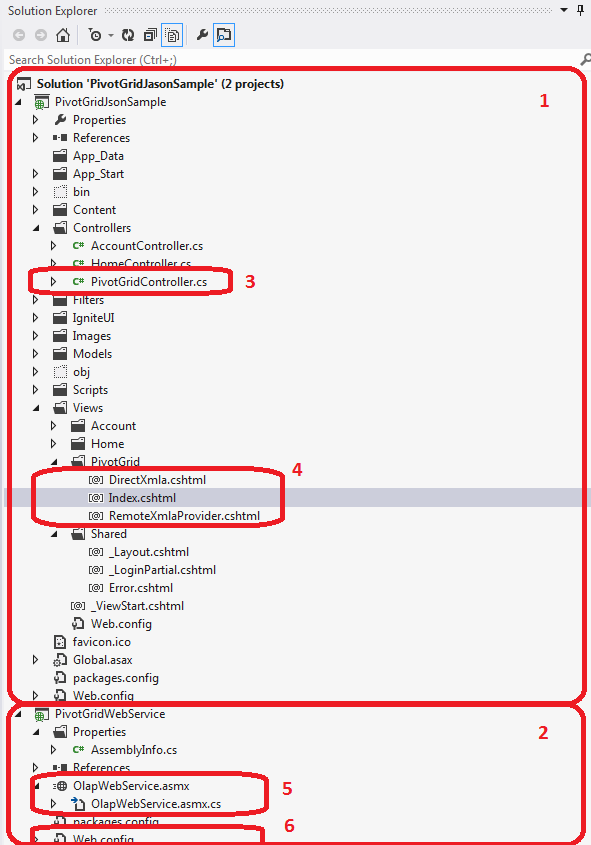
We have 2 projects in the solution:


1. WEB client – ASP.Net MVC 4

2. ASMX service (used for JSON serialization of the XMLA data)


In the WEB client (ASP.Net MVC 4 ) application there are :

3. PivotGridController (contains controllers implementations for all views (direct and remote XMLA, remote JSON)

4. Views :

  • DirectXmla (Direct XMLA implementation)
  • Index (Remote JSON via XMLA )
  • RemoteXmlaProvider (Remote XMLA implementation)

5. OlabWebService (ASMX service, used for JSON serialization )

6. WEB config (you need to allow Cross-origin resource sharing for ASMX service)


Demo project structure


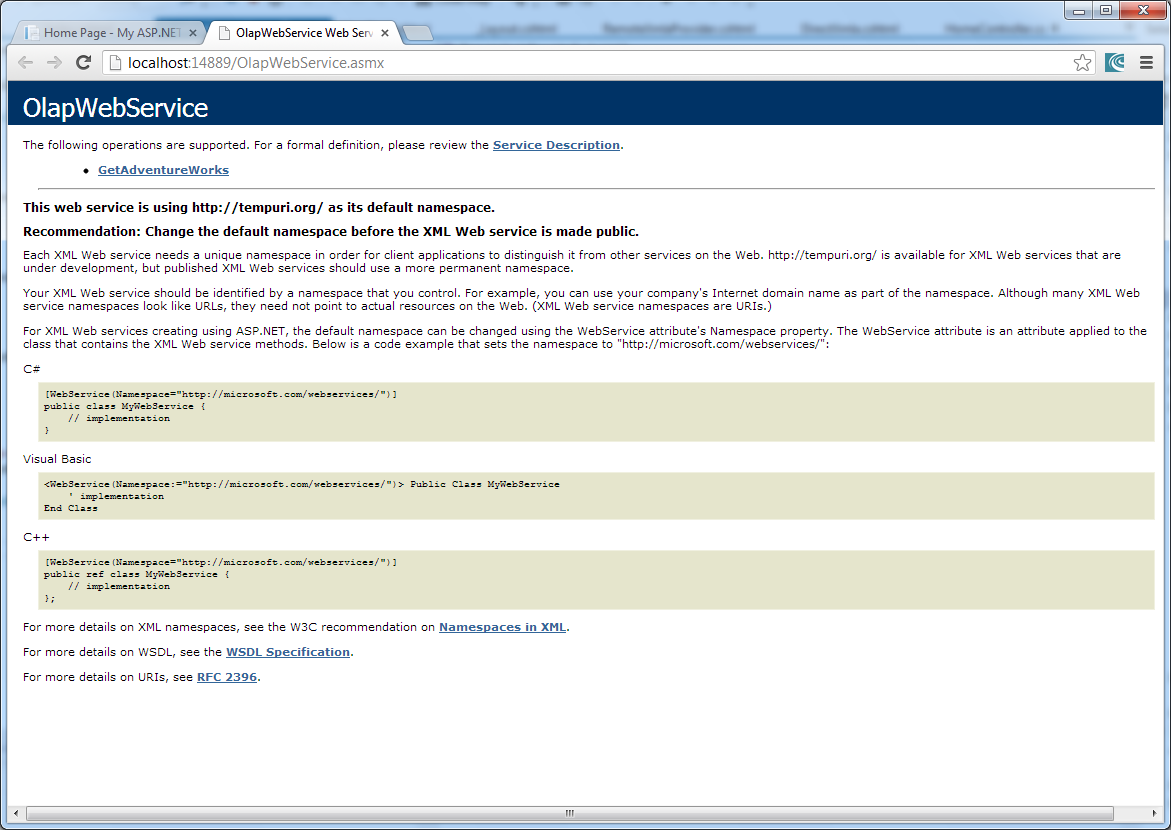
Web Service


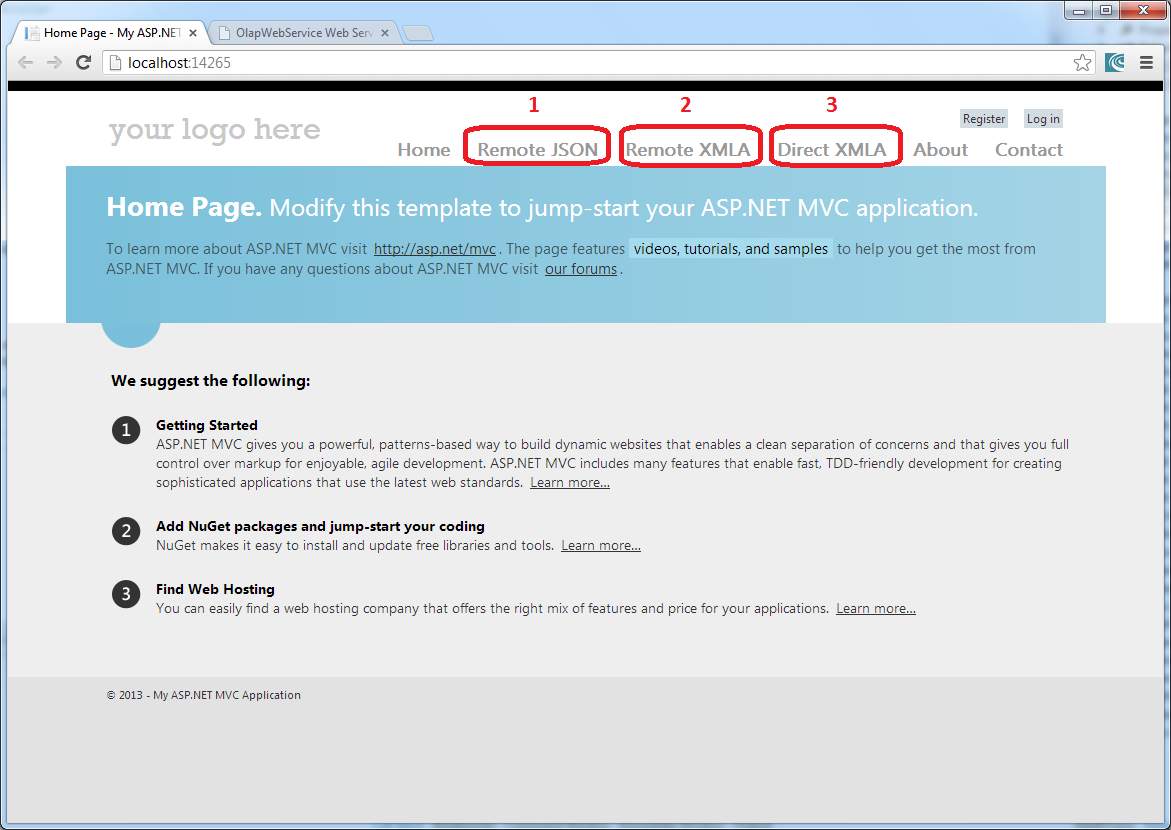
Landing page layout


From the landing page there are added three links that calls controllers / respectively return views for the each case that the sample covers:

  1. Remote JSON provider
  2. Remote XMLA provider
  3. Direct XMLA


Direct XMLA Access


The Controller (In this case controller just returns a view)

   1:public ActionResult DirectXmla()
   2: {
   3:return View();
   4: }


Data source definition.

Here the Url points to the address for SQL Server HTTP Access for OLAP

   1: dataSource = new $.ig.OlapXmlaDataSource({
   2:     serverUrl: 'http://sampledata.infragistics.com/olap/msmdpump.dll',
   3:     catalog: 'Adventure Works DW Standard Edition',
   4:     cube: 'Adventure Works',
   5:     rows: '[Date].[Calendar]',
   6:     columns: '[Product].[Product Categories]',
   7:     measures: '[Measures].[Internet Order Count]'
   8: });


Ignite UI PivotGrid definition – direct XMLA (igPivotGrid just uses data source – there are no specific settings)

   1: $directGrid.igPivotGrid({
   2:     dataSource: dataSource,
   3:     width: "915px",
   4:     height: "450px",
   5:     hideFiltersDropArea: true,
   6:     disableColumnsDropArea: true,
   7:     disableRowsDropArea: true,
   8:     disableMeasuresDropArea: true,
   9:     tupleMemberExpanding: function (evt, ui) {
  10:         toggleTupleMember(true, $directGrid, ui.axisName, ui.tupleIndex, ui.memberIndex);
  11:     },
  12:     tupleMemberCollapsing: function (evt, ui) {
  13:         toggleTupleMember(false, $directGrid, ui.axisName, ui.tupleIndex, ui.memberIndex);
  14:     }
  15: });


Direct XMLA View (Razor)

Below you could see the whole view code.

   1:  
   2: @{
   3:     Layout = null;
   4: }
   5:<!DOCTYPEhtml>
   6:  
   7:<html>
   8:<head>
   9:<title></title>
  10:  
  11:<!-- Ignite UI Required Combined CSS Files -->
  12:<linkhref="@Url.Content("~/igniteui/css/themes/infragistics/infragistics.theme.css")"rel="stylesheet"/>
  13:<linkhref="@Url.Content("~/igniteui/css/structure/infragistics.css")"rel="stylesheet"/>
  14:  
  15:     @Scripts.Render("~/bundles/jquery")
  16:     @Scripts.Render("~/bundles/jqueryui")
  17:  
  18:<!-- Ignite UI Required Combined JavaScript Files -->
  19:<scriptsrc="@Url.Content("~/igniteui/js/infragistics.core.js")"></script>
   1:  
   2:<script src="@Url.Content("~/igniteui/js/infragistics.lob.js")">
   1:</script>
   2:  
   3:</head>
   4:<body>
   5:  
   6:<script type="text/javascript">
   7:         $.support.cors = true;
   8:         $(function () {
   9:var dataSource,
  10:                 remoteDataSource,
  11:                 remoteSize = { u: 0, d: 0 },
  12:                 directSize = { u: 0, d: 0 },
  13:                 $directGrid = $("#directPivotGrid"),
  14://$remoteGrid = $("#remotePivotGrid"),
  15:                 toggleTupleMember = function (expand, pivotGrid, axisName, tupleIndex, memberIndex) {
  16:var friendlyAxisName = axisName == "Axis0" ? "columnAxis" : "rowAxis";
  17:if (expand) {
  18:                         pivotGrid.igPivotGrid("expandTupleMember", friendlyAxisName, tupleIndex, memberIndex, true);
  19:                     }
  20:else {
  21:                         pivotGrid.igPivotGrid("collapseTupleMember", friendlyAxisName, tupleIndex, memberIndex, true);
  22:                     }
  23:                 };
  24:  
  25:  
  26:             $(document).ajaxComplete(function (event, request, settings) {
  27:if (settings.url.match("http://localhost:14889/OlapWebService.asmx/GetAdventureWorks")) {
  28:                     remoteSize.u += settings.data.length;
  29:                     remoteSize.d += request.responseText.length;
  30:                     $("#transferSize").text("Uploaded: " + (remoteSize.u / 1024).toFixed(2) + " KB, Downloaded: " + (remoteSize.d / 1024).toFixed(2) + " KB").show();
  31:                 }
  32:elseif (settings.url.match("(.*/)?remote-xmla-provider-endpoint(.*)")) {
  33:                     remoteSize.u += settings.data.length;
  34:                     remoteSize.d += request.responseText.length;
  35:                     $("#transferSize").text("Uploaded: " + (remoteSize.u / 1024).toFixed(2) + " KB, Downloaded: " + (remoteSize.d / 1024).toFixed(2) + " KB").show();
  36:                 }
  37:elseif (settings.url === "http://sampledata.infragistics.com/olap/msmdpump.dll") {
  38:                     directSize.u += settings.data.length;
  39:                     directSize.d += request.responseText.length;
  40:                     $("#transferSize").text("Uploaded: " + (directSize.u / 1024).toFixed(2) + " KB, Downloaded: " + (directSize.d / 1024).toFixed(2) + " KB").show();
  41:                 }
  42:             });
  43:  
  44:  
  45:  
  46:             dataSource = new $.ig.OlapXmlaDataSource({
  47:                 serverUrl: 'http://sampledata.infragistics.com/olap/msmdpump.dll',
  48:                 catalog: 'Adventure Works DW Standard Edition',
  49:                 cube: 'Adventure Works',
  50:                 rows: '[Date].[Calendar]',
  51:                 columns: '[Product].[Product Categories]',
  52:                 measures: '[Measures].[Internet Order Count]'
  53:             });
  54:  
  55:  
  56:             $directGrid.igPivotGrid({
  57:                 dataSource: dataSource,
  58:                 width: "915px",
  59:                 height: "450px",
  60:                 hideFiltersDropArea: true,
  61:                 disableColumnsDropArea: true,
  62:                 disableRowsDropArea: true,
  63:                 disableMeasuresDropArea: true,
  64:                 tupleMemberExpanding: function (evt, ui) {
  65:                     toggleTupleMember(true, $directGrid, ui.axisName, ui.tupleIndex, ui.memberIndex);
  66:                 },
  67:                 tupleMemberCollapsing: function (evt, ui) {
  68:                     toggleTupleMember(false, $directGrid, ui.axisName, ui.tupleIndex, ui.memberIndex);
  69:                 }
  70:             });
  71:         });
  72:
</script>
  20:  
  21:<h5>Direct XMLA Access</h5>
  22:<h5id="transferSize">Uploaded: 0KB, Downloaded: 0 KB</h5>
  23:  
  24:  
  25:<divid="directPivotGrid"></div>
  26:</body>
  27:</html>


Remote XMLA Provider


Controller implementation. In this case you need to add a specific attribute “remote-xmla-provider-endpoint” for your action in the controller. XmlaDataSourceModel is a class implemented in Ignite UI .Net libraries and you need to use it as a context for your view. To initialize the model you need to add a server Url for OLAP HTTP access.

   1: [XmlaDataSourceAction]
   2:  [ActionName("remote-xmla-provider-endpoint")]
   3:public ActionResult RemoteXmlaProviderEndpoint()
   4:  {
   5:return View(new XmlaDataSourceModel { ServerUrl = "http://sampledata.infragistics.com/olap/msmdpump.dll" });
   6:  }


Remote DataSource. In this case for serverUrl you need to use the action in the MVC controller: '@Url.Action("remote-xmla-provider-endpoint")'

   1: remoteDataSource = new $.ig.OlapXmlaDataSource({
   2:      isRemote: true,
   3:      serverUrl: '@Url.Action("remote-xmla-provider-endpoint")',
   4:      catalog: 'Adventure Works DW Standard Edition',
   5:      cube: 'Adventure Works',
   6:      rows: '[Date].[Calendar]',
   7:      columns: '[Product].[Product Categories]',
   8:      measures: '[Measures].[Internet Order Count]'
   9:  });


Pivot Grid implementation (there is nothing specific – all differences are in igDataSource).

   1: $remoteGrid.igPivotGrid({
   2:     dataSource: remoteDataSource,
   3:     width: "915px",
   4:     height: "450px",
   5:     hideFiltersDropArea: true,
   6:     disableColumnsDropArea: true,
   7:     disableRowsDropArea: true,
   8:     disableMeasuresDropArea: true,
   9:     tupleMemberExpanding: function (evt, ui) {
  10:         toggleTupleMember(true, $remoteGrid, ui.axisName, ui.tupleIndex, ui.memberIndex);
  11:     },
  12:     tupleMemberCollapsing: function (evt, ui) {
  13:         toggleTupleMember(false, $remoteGrid, ui.axisName, ui.tupleIndex, ui.memberIndex);
  14:     }
  15: });


Remote XMLA View (Razor)

You could see the code of the whole view below.

   1: @{
   2:     Layout = null;
   3: }
   4:<!DOCTYPEhtml>
   5:  
   6:<html>
   7:<head>
   8:<title></title>
   9:  
  10:<!-- Ignite UI Required Combined CSS Files -->
  11:<linkhref="@Url.Content("~/igniteui/css/themes/infragistics/infragistics.theme.css")"rel="stylesheet"/>
  12:<linkhref="@Url.Content("~/igniteui/css/structure/infragistics.css")"rel="stylesheet"/>
  13:  
  14:     @Scripts.Render("~/bundles/jquery")
  15:     @Scripts.Render("~/bundles/jqueryui")
  16:  
  17:<!-- Ignite UI Required Combined JavaScript Files -->
  18:<scriptsrc="@Url.Content("~/igniteui/js/infragistics.core.js")"></script>
   1:  
   2:<script src="@Url.Content("~/igniteui/js/infragistics.lob.js")">
   1:</script>
   2:  
   3:</head>
   4:<body>
   5:  
   6:<script type="text/javascript">
   7:         $.support.cors = true;
   8:         $(function () {
   9:var dataSource,
  10:                 remoteDataSource,
  11:                 remoteSize = { u: 0, d: 0 },
  12:                 directSize = { u: 0, d: 0 },
  13:                 $remoteGrid = $("#remotePivotGrid"),
  14:                 toggleTupleMember = function (expand, pivotGrid, axisName, tupleIndex, memberIndex) {
  15:var friendlyAxisName = axisName == "Axis0" ? "columnAxis" : "rowAxis";
  16:if (expand) {
  17:                         pivotGrid.igPivotGrid("expandTupleMember", friendlyAxisName, tupleIndex, memberIndex, true);
  18:                     }
  19:else {
  20:                         pivotGrid.igPivotGrid("collapseTupleMember", friendlyAxisName, tupleIndex, memberIndex, true);
  21:                     }
  22:                 };
  23:  
  24:  
  25:             $(document).ajaxComplete(function (event, request, settings) {
  26:if (settings.url.match("http://localhost:14889/OlapWebService.asmx/GetAdventureWorks")) {
  27:                     remoteSize.u += settings.data.length;
  28:                     remoteSize.d += request.responseText.length;
  29:                     $("#transferSize").text("Uploaded: " + (remoteSize.u / 1024).toFixed(2) + " KB, Downloaded: " + (remoteSize.d / 1024).toFixed(2) + " KB").show();
  30:                 }
  31:elseif (settings.url.match("(.*/)?remote-xmla-provider-endpoint(.*)")) {
  32:                     remoteSize.u += settings.data.length;
  33:                     remoteSize.d += request.responseText.length;
  34:                     $("#transferSize").text("Uploaded: " + (remoteSize.u / 1024).toFixed(2) + " KB, Downloaded: " + (remoteSize.d / 1024).toFixed(2) + " KB").show();
  35:                 }
  36:elseif (settings.url === "http://sampledata.infragistics.com/olap/msmdpump.dll") {
  37:                     directSize.u += settings.data.length;
  38:                     directSize.d += request.responseText.length;
  39:                     $("#transferSize").text("Uploaded: " + (directSize.u / 1024).toFixed(2) + " KB, Downloaded: " + (directSize.d / 1024).toFixed(2) + " KB").show();
  40:                 }
  41:             });
  42:  
  43:  
  44:             remoteDataSource = new $.ig.OlapXmlaDataSource({
  45:                 isRemote: true,
  46:                 serverUrl: '@Url.Action("remote-xmla-provider-endpoint")',
  47:                 catalog: 'Adventure Works DW Standard Edition',
  48:                 cube: 'Adventure Works',
  49:                 rows: '[Date].[Calendar]',
  50:                 columns: '[Product].[Product Categories]',
  51:                 measures: '[Measures].[Internet Order Count]'
  52:             });
  53:  
  54:             $remoteGrid.igPivotGrid({
  55:                 dataSource: remoteDataSource,
  56:                 width: "915px",
  57:                 height: "450px",
  58:                 hideFiltersDropArea: true,
  59:                 disableColumnsDropArea: true,
  60:                 disableRowsDropArea: true,
  61:                 disableMeasuresDropArea: true,
  62:                 tupleMemberExpanding: function (evt, ui) {
  63:                     toggleTupleMember(true, $remoteGrid, ui.axisName, ui.tupleIndex, ui.memberIndex);
  64:                 },
  65:                 tupleMemberCollapsing: function (evt, ui) {
  66:                     toggleTupleMember(false, $remoteGrid, ui.axisName, ui.tupleIndex, ui.memberIndex);
  67:                 }
  68:             });
  69:         });
  70:
</script>
  19:  
  20:<h5>Remote XMLA Access</h5>
  21:<h5id="transferSize">Uploaded: 0KB, Downloaded: 0 KB</h5>
  22:  
  23:  
  24:<divid="remotePivotGrid"></div>
  25:</body>
  26:</html>


Remote JSON (using WEB service *.asmx)


The Controller

When you have own serialization controller just returns the view

   1:public ActionResult Index()
   2: {
   3:return View();
   4: }


Remote JSON WEB service (ASMX service)

In your implementation you need to create XmlaDataSourceModel and XmlaDataSourceManager that should be used to create a query.

Result is serialized as JSON – You can use for the your web method an attribute [ScriptMethod(ResponseFormat = ResponseFormat.Json)].

   1:/// <summary>
   2:/// Summary description for OlapWebService
   3:/// </summary>
   4: [ScriptService] 
   5: [WebService(Namespace = "http://tempuri.org/")]
   6: [WebServiceBinding(ConformsTo = WsiProfiles.BasicProfile1_1)]
   7: [System.ComponentModel.ToolboxItem(false)]
   8:publicclass OlapWebService : System.Web.Services.WebService
   9: {
  10:  
  11:     [WebMethod]
  12:     [ScriptMethod(ResponseFormat = ResponseFormat.Json)]
  13:publicstring GetAdventureWorks()
  14:     {
  15:conststring serverUrl = "http://sampledata.infragistics.com/olap/msmdpump.dll";
  16:  
  17:         var model = new XmlaDataSourceModel { ServerUrl = serverUrl };
  18:         var mng = new XmlaDataSourceManager();
  19:string result = mng.DoQuery(model, this.Context.Request);
  20:  
  21:return result;
  22:     }
  23: }


  • Remote JSON view implementation


Remote Data Source using JSON (you need to use for serverUrl the Url of the your web method in the asmx service)

   1: remoteDataSource = new $.ig.OlapXmlaDataSource({
   2:     isRemote: true,
   3:     serverUrl: 'http://localhost:14889/OlapWebService.asmx/GetAdventureWorks',
   4:     catalog: 'Adventure Works DW Standard Edition',
   5:     cube: 'Adventure Works',
   6:     rows: '[Date].[Calendar]',
   7:     columns: '[Product].[Product Categories]',
   8:     measures: '[Measures].[Internet Order Count]'
   9: });


Ignite UI Pivot Grid implementation (it is the same like in Direct XAML and Remote XMLA implementations)

   1: $remoteGrid.igPivotGrid({
   2:     dataSource: remoteDataSource,
   3:     width: "915px",
   4:     height: "450px",
   5:     hideFiltersDropArea: true,
   6:     disableColumnsDropArea: true,
   7:     disableRowsDropArea: true,
   8:     disableMeasuresDropArea: true,
   9:     tupleMemberExpanding: function (evt, ui) {
  10:         toggleTupleMember(true, $remoteGrid, ui.axisName, ui.tupleIndex, ui.memberIndex);
  11:     },
  12:     tupleMemberCollapsing: function (evt, ui) {
  13:         toggleTupleMember(false, $remoteGrid, ui.axisName, ui.tupleIndex, ui.memberIndex);
  14:     }
  15: });


The whole Remote JSON View (Razor)

The whole view is available here:

   1: @{
   2:     Layout = null;
   3: }
   4:<!DOCTYPEhtml>
   5:  
   6:<html>
   7:<head>
   8:<title></title>
   9:  
  10:<!-- Ignite UI Required Combined CSS Files -->
  11:<linkhref="@Url.Content("~/igniteui/css/themes/infragistics/infragistics.theme.css")"rel="stylesheet"/>
  12:<linkhref="@Url.Content("~/igniteui/css/structure/infragistics.css")"rel="stylesheet"/>
  13:  
  14:     @Scripts.Render("~/bundles/jquery")
  15:     @Scripts.Render("~/bundles/jqueryui")
  16:  
  17:<!-- Ignite UI Required Combined JavaScript Files -->
  18:<scriptsrc="@Url.Content("~/igniteui/js/infragistics.core.js")"></script>
   1:  
   2:<script src="@Url.Content("~/igniteui/js/infragistics.lob.js")">
   1:</script>
   2:  
   3:</head>
   4:<body>
   5:  
   6:<script type="text/javascript">
   7:         $.support.cors = true;
   8:         $(function () {
   9:var dataSource,
  10:                 remoteDataSource,
  11:                 remoteSize = { u: 0, d: 0 },
  12:                 directSize = { u: 0, d: 0 },
  13:                 $directGrid = $("#directPivotGrid"),
  14:                 $remoteGrid = $("#remotePivotGrid"),
  15:                 toggleTupleMember = function (expand, pivotGrid, axisName, tupleIndex, memberIndex) {
  16:var friendlyAxisName = axisName == "Axis0" ? "columnAxis" : "rowAxis";
  17:if (expand) {
  18:                         pivotGrid.igPivotGrid("expandTupleMember", friendlyAxisName, tupleIndex, memberIndex, true);
  19:                     }
  20:else {
  21:                         pivotGrid.igPivotGrid("collapseTupleMember", friendlyAxisName, tupleIndex, memberIndex, true);
  22:                     }
  23:                 };
  24:  
  25:  
  26:             $(document).ajaxComplete(function (event, request, settings) {
  27:if (settings.url.match("http://localhost:14889/OlapWebService.asmx/GetAdventureWorks")) {
  28:                     remoteSize.u += settings.data.length;
  29:                     remoteSize.d += request.responseText.length;
  30:                     $("#transferSize").text("Uploaded: " + (remoteSize.u / 1024).toFixed(2) + " KB, Downloaded: " + (remoteSize.d / 1024).toFixed(2) + " KB").show();
  31:                 }
  32:elseif (settings.url.match("(.*/)?remote-xmla-provider-endpoint(.*)")) {
  33:                     remoteSize.u += settings.data.length;
  34:                     remoteSize.d += request.responseText.length;
  35:                     $("#transferSize").text("Uploaded: " + (remoteSize.u / 1024).toFixed(2) + " KB, Downloaded: " + (remoteSize.d / 1024).toFixed(2) + " KB").show();
  36:                 }
  37:elseif (settings.url === "http://sampledata.infragistics.com/olap/msmdpump.dll") {
  38:                     directSize.u += settings.data.length;
  39:                     directSize.d += request.responseText.length;
  40:                     $("#transferSize").text("Uploaded: " + (directSize.u / 1024).toFixed(2) + " KB, Downloaded: " + (directSize.d / 1024).toFixed(2) + " KB").show();
  41:                 }
  42:             });
  43:  
  44:  
  45:             remoteDataSource = new $.ig.OlapXmlaDataSource({
  46:                 isRemote: true,
  47:                 serverUrl: 'http://localhost:14889/OlapWebService.asmx/GetAdventureWorks',
  48:                 catalog: 'Adventure Works DW Standard Edition',
  49:                 cube: 'Adventure Works',
  50:                 rows: '[Date].[Calendar]',
  51:                 columns: '[Product].[Product Categories]',
  52:                 measures: '[Measures].[Internet Order Count]'
  53:             });
  54:  
  55:             $remoteGrid.igPivotGrid({
  56:                 dataSource: remoteDataSource,
  57:                 width: "915px",
  58:                 height: "450px",
  59:                 hideFiltersDropArea: true,
  60:                 disableColumnsDropArea: true,
  61:                 disableRowsDropArea: true,
  62:                 disableMeasuresDropArea: true,
  63:                 tupleMemberExpanding: function (evt, ui) {
  64:                     toggleTupleMember(true, $remoteGrid, ui.axisName, ui.tupleIndex, ui.memberIndex);
  65:                 },
  66:                 tupleMemberCollapsing: function (evt, ui) {
  67:                     toggleTupleMember(false, $remoteGrid, ui.axisName, ui.tupleIndex, ui.memberIndex);
  68:                 }
  69:             });
  70:         });
  71:
</script>
  19:  
  20:<h5>Remote JSON Access</h5>
  21:<h5id="transferSize">Uploaded: 0KB, Downloaded: 0 KB</h5>
  22:  
  23:  
  24:<divid="remotePivotGrid"></div>
  25:</body>
  26:</html>


WEB config file

You need to add the lines below to your WEB.config file (you need to allow Cross-origin resource sharing for ASMX service). IE now 10 doesn’t require this settings but you need to add it for other browsers.

   1:<system.webServer>
   2:   ....
   3:<httpProtocol>
   4:<customHeaders>
   5:<addname="Access-Control-Allow-Origin"value="*"/>
   6:<addname="Access-Control-Allow-Headers"value="Origin, X-Requested-With, Content-Type, Accept"/>
   7:</customHeaders>
   8:</httpProtocol>
   9:</system.webServer>


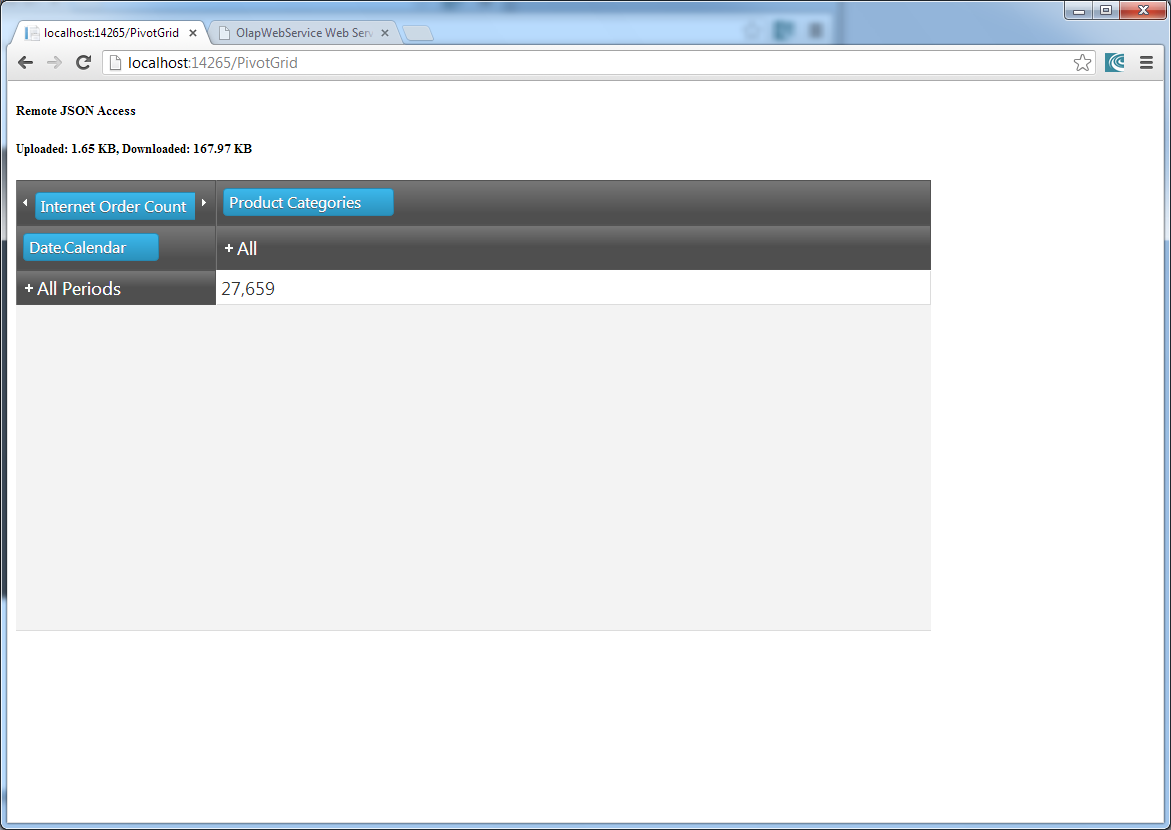
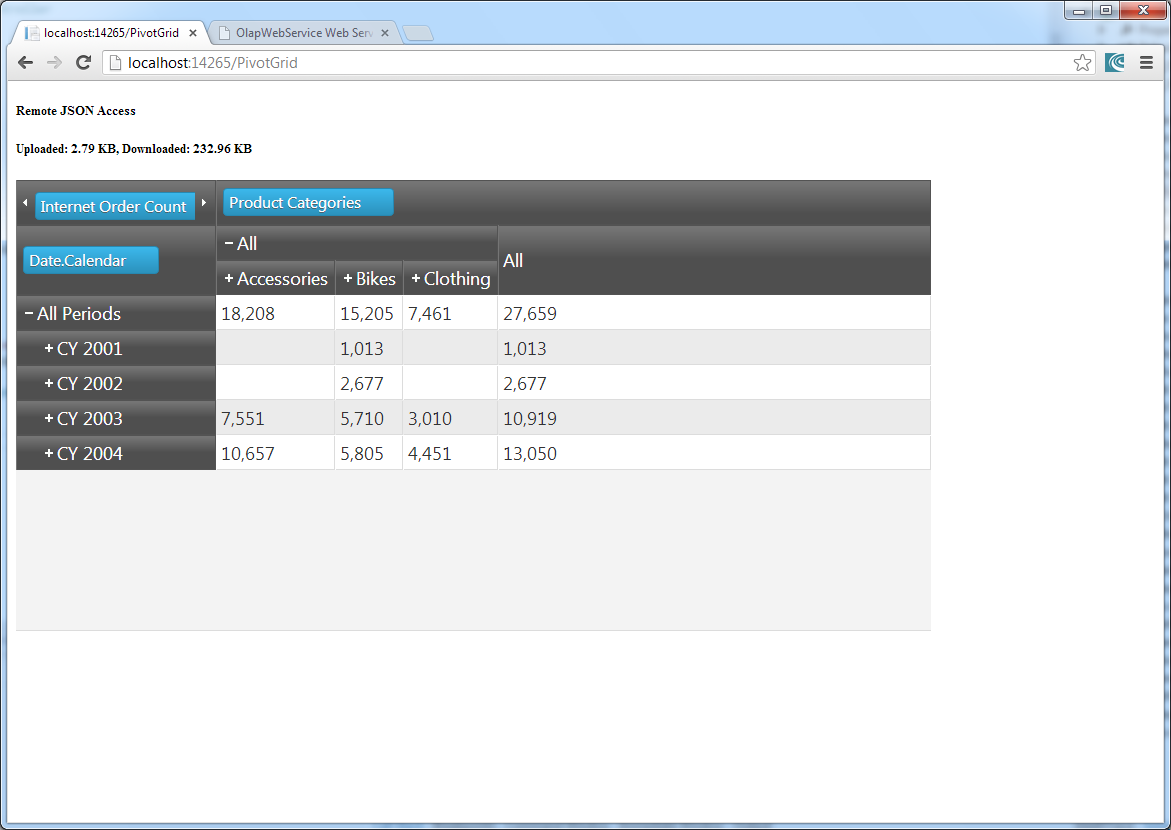
Running Pivot using JSON via WEB service


Remote JSON implementation (this is the first option)


Select Remote XMLA link to open the view with Remote XMLA implementation. In this case you will see that the data traffic from the remote WEB server to your client is more than  5 times more larger.


Select Direct XMLA link to redirect to Direct XMLA view. In this case you will see the pivot grid with the same data


Conclusions:


Infragistics Ignite UI supports XAML out of the box via Data Source (igDataSource) option “serverUrl”

You could use remote and direct XMLA providers. It is easy to implement own WEB service where to serialize data to JSON and Data Source could use this format.

Remote access leads to less data transfer and it will be better to use this approach (doesn’t matter which format you are using: XMLA or JSON)


Sample source code with all referenced scripts and libraries you could download here:


You are probably thinking, how do I get my hands on Ignite UI Pivot Grid?  It’s easy. 

Click on this image to get a fully support trial version of Infragistics Ignite UI controls:

IgniteUI-download[1]

To view all the samples and code for HTML, MVC & ASP.NET, click here: .

http://www.infragistics.com/products/jquery/samples


Follow news from Infragistics for more information about new Infragistics products.

As always, you can follow us on Twitter @mihailmateev and @Infragistics and stay in touch on Facebook, Google+andLinkedIn!

iOS Using Bluetooth to talk to other iOS Devices

$
0
0
So here's the scenario. You're writing an app, and you realize that it would be really cool if the stuff your app creates could be shared with other people. Sure you can go down the typical root of sharing through e-mail, dropbox, iMessage, etc.. However, your app is a collaborative tool, and the person who you want to share with, sits right across from you. It seems kind of silly to send your file to some server somewhere and bounce it back to them. Well, today i'm going to show you...(read more)

Codrops - HTML5 Resource of the Day

$
0
0

Today’s resource is a quick one. I’m on the road speaking at Stir Trek so I don’t have a whole lot of time to comment on the resource. With that being the case I wanted to pick something that could stand up on its own merits without much explanation. And with that, I give you: Codrops and the Collective.

Codrops

From their website: “Codrops is a web design and development blog that publishes articles and tutorials about the latest web trends, techniques and new possibilities.” In other words, this is just another great place to gain high quality knowledge. Here’s a sampling of some of the tutorials you will find there:

tutorials

Collective

The Collective is another one of these weekly article roundups that are very popular right now. It is one that I read just about every week because their curation is solid. They really do find the coolest and best articles in the web development and design world. The latest issue is Collective #63. Check it out today!

collective

Summary

Codrops is a wonderful resource for learning really cool new things in the web development and design world. The Collective helps in your quest to never miss a great article on these topics. I’d highly recommend checking out what Codrops has to offer. While you’re checking out new things, don’t forget to try Ignite UI!

Contact

If you have any questions or comments in the meantime, please feel free to email me at bschooley@infragistics.com or find me on Twitter @brentschooley.

Showing the XamDialogWindow from a ViewModel in Silverlight and WPF

$
0
0

The Problem

If you have used the Infragistics xamDialogWindow control in your WPF or Silverlight application, I can probably guess your biggest complaint with the control.  I know what mine is!  Currently, the XamDialogWindow has to be part of the visual tree in order for you to use it in your View.  What do I mean by that?  It means that you have to predefine your XamDialogWindow above the top most element in your View, being sure to add any Grid.RowSpan and Grid.ColumnSpan properties, so that it will be properly displayed when you show the dialog to the user by using the WindowState property or calling the Show method.  If that still isn’t clear, let the code do the talking.

This is what I have to do:

<Grid x:Name="LayoutRoot" Background="White">
    <ig:XamDialogWindow x:Name="_xamDialogWindow" StartupPosition="Center" WindowState="Hidden">
        <StackPanel Margin="25" Orientation="Horizontal">
            <Button Width="75" Margin="4" Content="OK" />
            <Button Width="75" Margin="4" Content="Cancel" />
        StackPanel>
    ig:XamDialogWindow>
    <Button Content="Show xamDialogWindow" VerticalAlignment="Center" HorizontalAlignment="Center"
            Click="Button_Click"/>
Grid>

privatevoid Button_Click(object sender, RoutedEventArgs e)
{
    _xamDialogWindow.Show();
}

Remember, the xamDialogWindow has to be part of the visual tree, so first I have to declare all instances of the xamDialogWindow that your View will need in XAML.  Once you have declared your xamDialogWindow instances, you must then provide some type of mechanism to display the dialog to your user.  In this example we add a simple button with an event handler.  Now, you could create some reusable derived dialogs that will allow you to encapsulate any dialog logic and help you reuse the dialog throughout your application, but you will still need to add it the visual tree of your View somehow.  This is not what I want to do.  I want it simple.  Very simple.

This is what I want to do:

XamDialogWindow dialog = newXamDialogWindow();
dialog.StartupPosition = StartupPosition.Center;
dialog.Show();

I want to be able to simply create a xamDialogWindow instance and have it displayed to the user whenever I call the XamDialogWindow.Show method.  It shouldn’t matter if I am in the code-behind (which I hope you aren’t), or from within my ViewModel (which you still shouldn’t be).  I’ll explain all that later.  It should be simple.

If you use the ChildWindow control in Silverlight, then you know exactly what I am talking about.  A common scenario is that you create a derived ChildWindow and then you can show it anywhere you feel like it form within your code.  Well, that is what we are going to do with the xamDialogWindow.

The Solution – Silverlight

In order to achieve our desired result, we need to create a derived version of the xamDialogWindow.  Let’s start with a new Silverlight application, and then add a new user control to the project.  Yes you heard me correctly, I said SILVERLIGHT!  This is what my derived dialog looks like.

<ig:XamDialogWindow x:Class="XamDialogWindowWithCode.Dialog"
    xmlns="http://schemas.microsoft.com/winfx/2006/xaml/presentation"
    xmlns:x="http://schemas.microsoft.com/winfx/2006/xaml"
             xmlns:ig="http://schemas.infragistics.com/xaml">
    
    <Grid x:Name="LayoutRoot" Background="White">
        <StackPanel Margin="25" Orientation="Horizontal">
            <Button Width="75" Margin="4" Content="OK" />
            <Button Width="75" Margin="4" Content="Cancel" />
        StackPanel>
    Grid>
    
ig:XamDialogWindow>

It’s nothing complicated.  Just a couple of buttons.  Now, you may be asking yourself, how are we going to get around this limitation of the control.  Simple!  We are going to place it inside a popup.  Let’s add some code to the code-behind to see what I mean.

publicpartialclassDialog : XamDialogWindow
{
    Popup _hostPopup;

    public Dialog()
    {
        InitializeComponent();
        WindowStateChanged += Dialog_WindowStateChanged;

        _hostPopup = newPopup();
        _hostPopup.Child = this;
    }

    void Dialog_WindowStateChanged(object sender, WindowStateChangedEventArgs e)
    {
        if (e.NewWindowState == Infragistics.Controls.Interactions.WindowState.Hidden)
            _hostPopup.IsOpen = false;
    }

    publicnewvoid Show()
    {
        base.Show();

        _hostPopup.IsOpen = true;
    }
}

All we did was programmatically create a Popup, set it’s content to the derived Dialog control, the control displaying the popup by creating a new Show method and making sure we close the Popup when the WindowState changes to Hidden.  Not so complicated now is it?  Now let’s look at how we can create an instance of the control in code and display it to our user by calling the Show method.


privatevoid Button_Click(object sender, RoutedEventArgs e)
{
    Dialog dialog = newDialog();
    dialog.Show();
}

xamDialogWindow in code behind for WPF and Silverlight

That’s it.  So what about a ViewModel?  Alright, in case you still don’t believe me that it will work in code no matter where you are at, let’s check out a ViewModel approach.

publicclassViewModel
{
    publicICommand ShowDialogCommand { get; privateset; }

    public ViewModel()
    {
        ShowDialogCommand = newShowDialogCommand();
    }
}

publicclassShowDialogCommand : ICommand
{
    publicbool CanExecute(object parameter)
    {
        returntrue;
    }

    publiceventEventHandler CanExecuteChanged;

    publicvoid Execute(object parameter)
    {
        Dialog dialog = newDialog();
        dialog.Show();
    }
}
<Grid x:Name="LayoutRoot" Background="White">
    <Button Content="Show xamDialogWindow" VerticalAlignment="Center" HorizontalAlignment="Center"
            Command="{Binding ShowDialogCommand}"/>
Grid>

We just created a simple ViewModel, a simple Command (since we aren’t using a DelagateCommand or a Relay Command), and then updated the View’s DataContext and set our Button’s binding.  Nothing complicated, yet we still get the same result when we click the button. 

image

Oh, and don’t worry, it will still work as Modal as well.  Just so you know, the gray is the Modal background.

A Modal XamDialogWindow in code behind for WPF and Silverlight

Now this particular sample was done in Silverlight, but the same approach can be taken in WPF. 

Solution – WPF

This was really easy to implement for Silverlight, but to get the same type of functionality in WPF, it will take a little extra work to get the Popup to behave like you want it to.  First let’s add a new WPF Application project to our Visual Studio Solution and immediately open up the Project Properties.  Now change the default namespace to match that of the Silverlight namespace.  Next, go to the Build tab and add a “Conditional compilation symbol” named WPF.  This will allow us to share all of our code across both WPF and Silverlight.

image

Now, let’s add both the Dialog.xaml/cs and the ViewModel.cs files from our Silverlight project to our WPF project as a file link.  Right click the WPF project and selected “Add Existing Item”.  Navigate to the Silverlight files and add the files as a link by selecting the drop down arrow in the add button and selecting the “Add as Link” option.

image

Now we will need to modify our Dialog.cs file to accommodate our WPF specifics.  First off, in Silverlight we don’t have to worry about multiple Windows like we do in WPF.  We also don’t have to worry about the moving of a Window or the resizing of a Window in Silverlight like we do in WPF.  The goal of the WPF version is to keep the Dialog within the bounds of the Window, but still be able to show the Dialog from code.  Also, if it’s Modal, we want to cover up the entire Window including the minimize, maximize, and close buttons.  We want it to be truly modal.  We will also need to handle the resizing of a parent Window and the movement of the Window.  Seems WPF introduces a lot of hurdles we must jump over, but it’s nothing we can’t handle.  I made some modifications to the Dialog.cs file.  Let’s look at the file, then talk about it.

    publicpartialclassDialog : XamDialogWindow
    {
        Popup _hostPopup;

#if WPF
        Window _parentWindow;
#endif

        public Dialog()
        {
            InitializeComponent();
            WindowStateChanged += Dialog_WindowStateChanged;

            _hostPopup = newPopup();
            _hostPopup.Child = this;
        }

        void Dialog_WindowStateChanged(object sender, WindowStateChangedEventArgs e)
        {
            if (e.NewWindowState == Infragistics.Controls.Interactions.WindowState.Hidden)
            {
#if WPF
                if (_parentWindow != null)
                {
                    //unhook our event handlers to prevent memory leaks
                    _parentWindow.LocationChanged -= ParentWindow_LocationChanged;
                    _parentWindow.SizeChanged -= ParentWindow_SizeChanged;
                }
#endif
                _hostPopup.IsOpen = false;

            }
        }

        publicnewvoid Show()
        {
            base.Show();

#if WPF
            _hostPopup.AllowsTransparency = true;

            foreach (Window window inApp.Current.Windows)
            {
                if (window.IsActive) //I want to show the popup over the current active window
                {
                    _parentWindow = window;

                    _hostPopup.PlacementTarget = _parentWindow;
                    _hostPopup.Placement = PlacementMode.Relative;

                    _hostPopup.HorizontalOffset = -7.5; //account for window padding
                    _hostPopup.VerticalOffset = -30.5; //account for window title bar

                    CalculatePopupSize();

                    _parentWindow.LocationChanged += ParentWindow_LocationChanged;
                    _parentWindow.SizeChanged += ParentWindow_SizeChanged;

                    break;
                }
            }
#endif
            _hostPopup.IsOpen = true;

        }

#if WPF
        void CalculatePopupSize()
        {
            _hostPopup.Width = _parentWindow.Width;
            _hostPopup.Height = _parentWindow.Height;
        }

        void ParentWindow_SizeChanged(object sender, SizeChangedEventArgs e)
        {
            CalculatePopupSize();
        }

        void ParentWindow_LocationChanged(object sender, System.EventArgs e)
        {
            //this forces the popup to re-evaluate it's positioning
            _hostPopup.Placement = PlacementMode.Custom;
            _hostPopup.Placement = PlacementMode.Relative;
        }
#endif

    }

The first thing you are going to notice it the addition of an #if WPF … #endif regions.  What this does is allows us to add WPF specific code to the WPF project without effecting the Silverlight application code.  Basically we say that anything inside the #if WPF region is to be compiled into the WPF project only and Silverlight will ignore it completely when you compile the Silverlight project.  Pretty col huh?

Now you will see the declaration of a private variable called _parentWindow because this is WPF and a WPF application can have many windows.  We have to know which Window is the parent of the Dialog.  Next we add code to the Dialog.Show method.  This code looks for the active Window, then sets the _parentWindow variable because we will need it later.  Next we set the host Popup.PlacementTarget to the active window, and set the Popup.Placement to Relative which will place the popup in the 0,0 location of the parent window content area.  Problem is that we want it to cover the ENTIRE window in the case of a Modal popup.  So we need to set the horizontal and vertical offsets to account for the Window title bar and border space.  Next, we need to calculate the size of the popup to be the same as the parent active window.

Next, there are two scenarios we need to handle.  One is when the parent window is dragged to a new location.  By default, Popups do not reposition themselves automatically when the parent is moved.  So, we hook into the LocationChanges event and toggles the _hostPopup.Placement property.  This will force the Popup to re-evaluate it’s position.  We also add a handler to the Window.SizeChanged event so when the user resizes the Window, our popup will be resized accordingly.  Lastly, we need to make sure that we unhook our event handlers from the parent window when we close the Dialog.

Now, we can show our Dialog in a non-modal mode with the ability to move the dialog around within the bounds of the window. 

XamDialogWindow in code WPF

Or, we can show the Dialog in a modal mode blocking all interaction with the contents of the windows including the minimize, maximize, an the close buttons.

XamDialogWindow in code Modal WPF

Taking it a Step Further

Now that you know how to show your custom dialog from just using code, let’s talk about how you SHOULD be using this new found power.  First off, don’t create and show your Dialog from your View’s code-behind file.  Why, because you should be using the MVVM pattern  when developing your XAML application, and we all know that anything in the code behind is strongly discouraged.

Now that we are all on the same page, and you are using the MVVM pattern to develop your Views, let’s discuss how you should call your Dialog from your ViewModel.  Unlike in this very simple demo where I am showing the Dialog from within my ViewModel, TRY NOT to do this.  A dialog is a View concern.  In MVVM, your ViewModel should have no knowledge of View specific implementations, including showing a dialog window.  How SHOULD you do it?  Well, you should be using a Dialog Service.  What is a Dialog Service?  A Dialog Service is a class that your ViewModel will know about, preferably only through an interface, that will abstract or hide the implementation of showing the Dialog you just created.

Unfortunately, I will not be covering a Dialog Service in this post.  Fortunately I will be writing a post on a Dialog Service soon.  It will discuss different approaches as well as handling callbacks in your ViewModel when the dialog closes so that you can handle the dialog result or other required tasks of the completed dialog.

Until then, feel free to download the source code and play around.  Contact me on my blog, connect with me on Twitter (@brianlagunas), or leave a comment below for any questions you may have.

Infragistics Friends Group Presentation:Introduction to Geoflow for Excel - Event Recap

$
0
0

Infragistics Friends group, BI & .NET Geeks (Bulgarian PASS Chapter) with the help of Infragistics Inc.  organized a presentation about Introduction to Geoflow for Excel. From 14th of January 2013 our group is an official PASS Chapter in Bulgaria under the name BI &. NET Geeks and we try to provide more BI and data visualization related content.

The event was held on Wednesday, May 15th at Infragistics Bulgaria Office, 110B, Simeonovsko Shosse Bul., Sofia, Bulgaria.

Geoflow is a 3D data visualization tool for Excel that provides a powerful method for people to look at information in new ways enabling discoveries in data that might never be seen in traditional 2D tables and charts. It 3D visual exploration with the ability to make direct comparisons of values and identify outliers by seeing data displayed in 2D charts at the same time.


Speaker was Ivan Donev .

Ivan Donev is a certified Microsoft IT Professional in Business intelligence, Database development and database administration since 2010 and dealing with different SQL Server projects and environments since 2007. He is also a certified trainer, active blogger and leader of www.mssqlinsider.com.

Presentation was focused on the modern trends in BI : better spatial data visualization and easier analysis, demonstrated via the new Beta of Geoflow for Excel.


Ivan Donev is presenting


Enjoy the great Geoflow spatial analysis.


As always, you can follow us on Twitter @mihailmateev and @Infragistics and stay in touch on Facebook,Google+andLinkedIn!

SQLSaturday #216 Krasnodar Event Recap

$
0
0

Infragistics Inc. was a gold sponsor of BI conference SQLSaturday # 216 Krasnodar. Company was also presented at SQLSaturday Krasnodar by me by me as a speaker.
The event was held on Saturday, May 18th 2013 at Business Center "Caucasus" in Krasnodar.

The event was organized from PASS and supported from the  Krasnodar SQL user group, Microsoft Russia, Infragistics Inc, Red Gate Software and other companies.

It was an very well organized event involving many good SQL, BI and. Net professionals from Russia, Ukraine and Bulgaria. Special Thanks to Andrey Korshikov, the Russian PASS community lead and RM, who did everything to be this conference successful.


There was 9 presentations in 2 tracks: Development, BI, DBA, Azure and other areas. Event schedule is available here.

Infragistics participation in the event:

There was 2 technical presentations from Infragistics Inc.:


Spatial Data with SQL Server Reporting Services : Speaker – Mihail Mateev
Windows Azure SQL Reporting for App developers : Speaker – Mihail Mateev

At the conference I presented the products of Infragistics Inc on behalf of the company as a sponsor

There was also an interest in the  Infragistics solutions, related to Data Visualization and Business Solutions. Infragistics presentations included samples solutions with WPF and ASP.Net MVC implemented with Infragistics components (NetAdvantage and Ignite UI).  At the conference were showcased and the mobile Infragistics applications  - SharePlus and ReportPlus


Presentations could be downloaded here:

Follow news from Infragistics for more information about new Infragistics events.

As always, you can follow us on Twitter @mihailmateev and @Infragistics and stay in touch on Facebook, Google+ andLinkedIn!


Top 10 Tools for Mac and iOS Development

$
0
0

Introduction

Having the right set of tools can take your development quality to the next level. This article provides you with my personal current top 10 apps to use for Mac and iOS development.

#1 - AppCode

#1 - AppCode

AppCode is a must have IDE for any serious developer on the Mac/iOS platform.

Features

  • Advanced Coding Assistance
  • Code Generation and Refactorings
  • Code Quality
  • Project and Code Navigation
  • i18n Support
  • Debugger
  • Unit Testing
  • iOS Development
  • VCS Integration and Local History
  • Integrations
  • More than Objective-C IDE
  • Customization and Extensibility


Website: http://www.jetbrains.com/objc/features/index.html

#2 - Indigo Studio

#2 - Indigo Studio

Prototype out your app ideas. Indigo Studio allows you to interactively prototype your web, desktop, and mobile apps. Major upside, it's free!

Features

  • Illustrate with Storyboards
  • Sketch and Design Screens
  • Design with Clutter-Free UI
  • Leverage Built-In UI Elements
  • Prototype and Visualize Interactions
  • Animate Transitions
  • Annotate Prototypes
  • Share and Present Prototypes
  • Export Prototype Designs


Website: http://www.infragistics.com/products/indigo-studio

#3 - Reflector

#3 - Reflector

An excellent tool for mirroring your iOS device screen when you have to demo or present to a group.

Features

  • Record. Easily capture the screen of your iOS device and save it as a video file for later review.
  • iOS On Your Mac. View your iOS device on your Mac and continue using it while you're mirroring.
  • Password Protection. Control access to your Mac by setting a password to prevent unwanted connections.
  • Selectable Frames. Change the color of the device frame on your screen to match the actual skin of your device.


Website: https://www.reflectorapp.com

#4 - xScope

#4 - xScope

A collection of valuable design and development tools all in one package.

Features

  • Mirror - Effortlessly see your designs and applications on iOS while you work on them from your Mac.
  • Dimensions - Instantly find the dimensions of any on-screen element simply by rolling your mouse cursor over it.
  • Rulers - Powerful on-screen rulers for precise pixel measurements that include scaling, rotation, and edge snapping.
  • Screens - Inspect your usable screen real estate with dozens of templates for computers, TV's and mobile devices.
  • Loupe - Magnify part of your screen, copy colors and simulate how colors appear to users with vision impairments.
  • Guides - Display vertical and horizontal guides that float on top of all else on the screen for easy alignment.
  • Frames - Create, layout and adjust custom marker boxes that float on top of all other on-screen elements.
  • Crosshair - Quickly and easily locate and align any point visible on the screen.


Website: http://xscopeapp.com

#5 - CodeRunner

#5 - CodeRunner

Edit and run code in any programming language. There's a bunch of preset languages already set up, and it's an easy task to add any other languages you might be using.

Features

  • Run code in any language
  • Powerful editing
  • Customizable templates
  • Built-in Console
  • Add your own languages
  • Interact with your code


Website: http://krillapps.com/coderunner/

#6 - Patterns

#6 - Patterns

A simple yet powerful tool for working with regular expressions. Includes a built in cheat sheet, if you need a little refresher.

Features

  • Regular expression syntax coloring makes it easy to see how your pattern is interpreted by the regex engine. No more confusion about what needs to be escaped.
  • See matches and replacements in real time while you edit your pattern.
  • Copy match and replacement code snippets of your pattern for quick use in a number of different programming languages.
  • The built-in regular expression reference sheet helps you find the piece of regex syntax you need.


Website: http://krillapps.com/patterns/

#7 - Clarify

#7 - Clarify

Quickly create tutorials and how-to documents.

Features

  • Capture images.
  • Each capture becomes a step in your document.
  • Add annotations and text to images.
  • Add text.
  • Share your document via DropBox or Clarify-it.com.
  • Share as a PDF.
  • Copy RTF to email or word processing documents.
  • Many ways to export images.


Website: http://www.clarify-it.com

#8 - ColorSchemer Studio 2

#8 - ColorSchemer Studio 2

Quickly create schemes. This tool has a GalleryBrowser button on the toolbar that provides access to millions of color palettes in addition to being able to create your own from scratch.

Features

  • Create and save color palettes.
  • Identify color harmonies.
  • Access over a million pre-made color schemes.
  • Pull unique palettes from photos or images.
  • Build custom LiveScheme formulas.
  • Transform a single color into a complete color scheme.
  • Mix colors and create gradient blends.
  • Find similar or related colors.
  • Preview colors on a variety of layouts.
  • View colors through colorblind eyes.
  • Print your color schemes.


Website: http://www.colorschemer.com/osx_info.php

#9 - Spectrum

#9 - Spectrum

Quickly create beautiful color schemes. Inspired by principles of color theory. This tool also makes it really easy to copy each color to the clipboard in a number of formats, including hex color code, UIColor, CIColor, etc.

Features

  • Create color schemes based on harmony rules.
  • Instantly explore tints and shades for a given color to fine tune the palette.
  • Automatically create color schemes from a photograph - great for inspirations.
  • Organize your palettes and create a searchable collection of color schemes.
  • Capture color from your screen using the built-in color picker tool.
  • Export your color schemes to CSS and ASE (for use in Adobe's Creative Suite).
  • Import colors from existing CSS and ASE files.
  • Instantly preview your color schemes using a variety of visualizations.
  • Configure color profiles.
  • Switch between two color wheel modes - perceptual and uniform.


Website: http://www.eigenlogik.com/spectrum/

#10 - ColoRotate

#10 - ColoRotate

Work fast. Edit color palettes with a few taps of your fingers. Easily analyze, extract, adjust, and share colors.

Features

  • Work fast. Edit your color palettes with a few taps of your fingers. Easily analyze, extract, adjust, and share colors.
  • Color smart. Take control of colors with the intuitive 3D color scope. There are powerful tools for extracting from images, adjusting with blends, making precise edits, or generating fresh ideas with randomized palettes.
  • Sociable colors. View your palettes with six different preview modes. Share with colleagues, clients and friends by email, Twitter, Facebook, Evernote, DropBox, or send to your photo library.
  • Works with Photoshop. Connect to Photoshop CS5 or CS6 and ColoRotate instantly updates the foreground & background colors, or sends palettes to your desktop.


Website: http://mobile.colorotate.org

By Torrey Betts

Web programming (HTML5/CSS3/jQuery) for beginners - the journey starts here…

$
0
0

Sometimes it’s hard to admit as programmers when we really don’t have a clue what we’re doing. This is especially evident when learning a new platform or technology. I am going through this exact experience right now as I try to get back into the web programming world. New tags in HTML5, new capabilities in CSS3, and various frameworks that make JavaScript feel much more modern. As my recent posts about HTML5 resources indicate, there’s a lot to learn once you get started. But what if you’re just getting started? Most of the resources out there assume you have some knowledge of HTML, CSS, and JavaScript. It can be hard to learn something new when everybody assumes more prerequisites than you actually know.

webforbeginners

Tracking progress, sharing knowledge

I want to create something that tracks bits and pieces of my learning process and tries to frame it under the ideal of “starting from the beginning”. This is admittedly a somewhat flawed premise since I am not starting from the very beginning (I did some Rails programming back in Rails 2), but I will do my best to describe things for the beginner. As I learn something new, I’ll share it. It doesn’t whether it’s a new fancy CSS trick or something that might seem extremely basic that I don’t want you to miss.(chances are I missed it the first time too!)

The format

This process will not be constrained by an outline up front and posts that follow that outline to the letter. That’s just not how the learning process tends to work. Sure, some of it is structured but a lot of learning happens randomly as we are introduced to new resources and concepts. If a concept is best conveyed by a tutorial, I’ll post a tutorial. Screencasts? Sure! Book reviews? You bet!

Where do I start?

Well, from the beginning would be best. While you wait for the posts from me to come in, I’d highly recommend the following resources for training. Both of these sites include coding challenges to help reinforce the knowledge you learn from the video training. Check out the free courses available from each to see if this will work for you:

Stay tuned, more content coming soon!

Contact

If you have any questions or comments in the meantime, please feel free to email me at bschooley@infragistics.com or find me on Twitter @brentschooley.

Accessing Salesforce data on the iPad

$
0
0

We have talked a lot recently about mobile design, mobile websites, and the surge in use of mobile devices in the enterprise. In this post we are going to look at a specific use case of the latter - Salesforce and the iPad.

Salesforce is best known for their customer relationship management (CRM) software which has found a great deal of success in the enterprise market. In recent years they have started to expand their focus towards social products, in particular Chatter, which is billed as a real-time collaboration network and has parallels with products like Yammer. Chatter is a good example of how Salesforce has reshaped itself as a dynamic innovative company, one keen to embrace new trends. These trends include ‘mobile first’, and the company has also tried to reach out and help its users as much as it can in this area.

Salesforce have their own mobile app called - Salesforce Touch for iPad. It is a well thought out affair, allowing users to:

  1. Access accounts, contacts, opportunities, and tasks
  2. Access Chatter feeds
  3. Edit data and create new records
  4. Search

The interface is nice, and it makes good use of the iPads screen real estate. The biggest drawback is the app still doesn’t provide access to all of the data available on the native Salesforce website, so it can’t be totally relied on in the field just yet. Nor does it offer anything groundbreaking in terms of dashboards or charts. It just isn’t very exciting, it doesn’t make data ‘pop’ off the screen. For that you will need something like our very own ReportPlus product.

ReportPlus is a dashboard and reporting tool that can connect to popular enterprise data sources like those provided by Salesforce. It is specially designed to provide easy access to data on iOS devices like the iPad, and takes a lot of the pain out of creating beautiful visualizations. It doesn't require programming knowledge or code of any sort, is easy to use, and the results can be very impressive. If your customers or workforce are looking for an alternative to the official Salesforce app, or you want to bring your Salesforce data to life in a whole new way, then ReportPlus might be the tool for you.

ReportPlus allows easy access to server side resources, like Salesforce, using domain credentials or username/password authentication. Then the real fun begins, as you can manipulate retrieved data sets to build rich functional, charts, trend lines, filters, and even geo-coded maps.

ReportPlus also offers the following features:

  1. Create interactive dashboards - Sort, filter, and manipulate data directly in the app
  2. Add logos, colors, and images - Brand your dashboards
  3. Save and export dashboards in a variety of formats - Share dashboards with colleagues via email, PowerPoint or the cloud.

So next time you are looking at your Salesforce data and wishing it had a little more shine, try ReportPlus. We think you will be impressed.

Software Engineer Interview Questions

$
0
0

Hiring is a tricky process. Employers need to identify a need for new skills, first being sure they aren’t somewhere already, hidden in their organization (it is so much better to hire from within).  Then, they need to advertise and get viable candidates.  Depending on the difficulty of sourcing good candidates, companies may partner with recruitment agents to assist.  Once they get to this stage the really hard work begins - the interview.

Conducting an effective interview is a learned skill, and endless articles and advice exists on what to do (and just as important, what not to do).  We are going to focus on one specific area - good questions to ask during the interview.  The questions below are designed to address the following:

  • To tell you as much about the interviewee in the short time given
  • To test the interviewee on his/her CV and what you think you already know about them
  • To test the interviewee on their raw coding ability and problem solving skills
  • To judge if the interviewee is a cultural fit for your organization.

These questions aren’t foolproof, and they don’t drift into Google style abstractterritory, but we hope you will find them useful next time you are hiring.

About the CV

1. “Tell me a little bit more about your role at X company.”

You want to check how well the interviewee’s CV stacks up.  Getting them to talk about it is the simplest way.

About coding and problem solving

2. “Explain the difference between ‘equality’ and ‘equivalence’.”

If a candidate can’t successfully answer this question then they should be considered ‘entry level’ at best.

3. “Tell me about design patterns, and give me an example of when you used them last.”

If the interviewee has never used design patterns, this will tell you a great deal.  If they have, the details should give you a view on how they solve problems.

4. “What language are you most comfortable in and why?”

If you are looking for a .NET person, and your potential candidate is exclusively PHP then you may have an issue.  But a good answer should have some thought and rationale behind it.  This is much more important than the actual language cited in the answer.  Ask about databases as an addition/alternative.

5. “How do you test your code?”

This doesn’t test any particular coding skill, but it does tell you a lot about their process.  All developers should be doing some kind of testing.  Depending on what you are looking for the answer might reveal someone who is conscientious in their work, or someone who knows all about test strategies and methodologies.

About character and personality

6. “Describe the work environment in which you feel you are most effective.”

This will tell you if the person is a cultural fit for your company. Their answer can’t really be right or wrong, but it can be an indicator of the cultural fit you're looking for. 

7. Why did you apply for this job?

You want a new teammate who wants to work for you, not someone who is simply working down the jobs ads from A-Z.  This question will root out these sort of applicants, and show the level of research the candidate has done on the opportunity and your company.

Interested in a career here at Infragistics? Check out our current openings!

Windows Azure datacentres coming to Australia!

$
0
0

Microsoft is planning to expand the Windows Azure regional datacentres to Australia. There are plans to add two new “sub-regions”, in Victoria and NSW.

This is exciting, because there have been an number of businesses and scenarios where due to regulator requirements on data sovereignty, they were unable to use the Azure locations hosted in other countries.
It is interesting to look at *why* Microsoft is deploying 2 new centres (Victoria & NSW), and not just in NSW. This comes down for the need to provide geo-redundancy, while still giving users data sovereignty in Australia.

This bodes well for any Australian start-up what wants to create a local service. The latency from US servers can cause a slight lag in requests, having their applications servers hosted locally will be great.
There is also the potential for some big name USA companies to start hosting geo-located edge servers here, so that their Australian customers get a more responsive experience. This could easily be done by using the Windows Azure Traffic Manager to manage multiple geo-located computer instances http://www.windowsazure.com/en-us/pricing/details/traffic-manager/

The official announcement is up on the Australian MSDN blog http://blogs.msdn.com/b/ausblog/archive/2013/05/16/windows-azure-expands-downunder.aspx

By David Burela

Viewing all 2374 articles
Browse latest View live