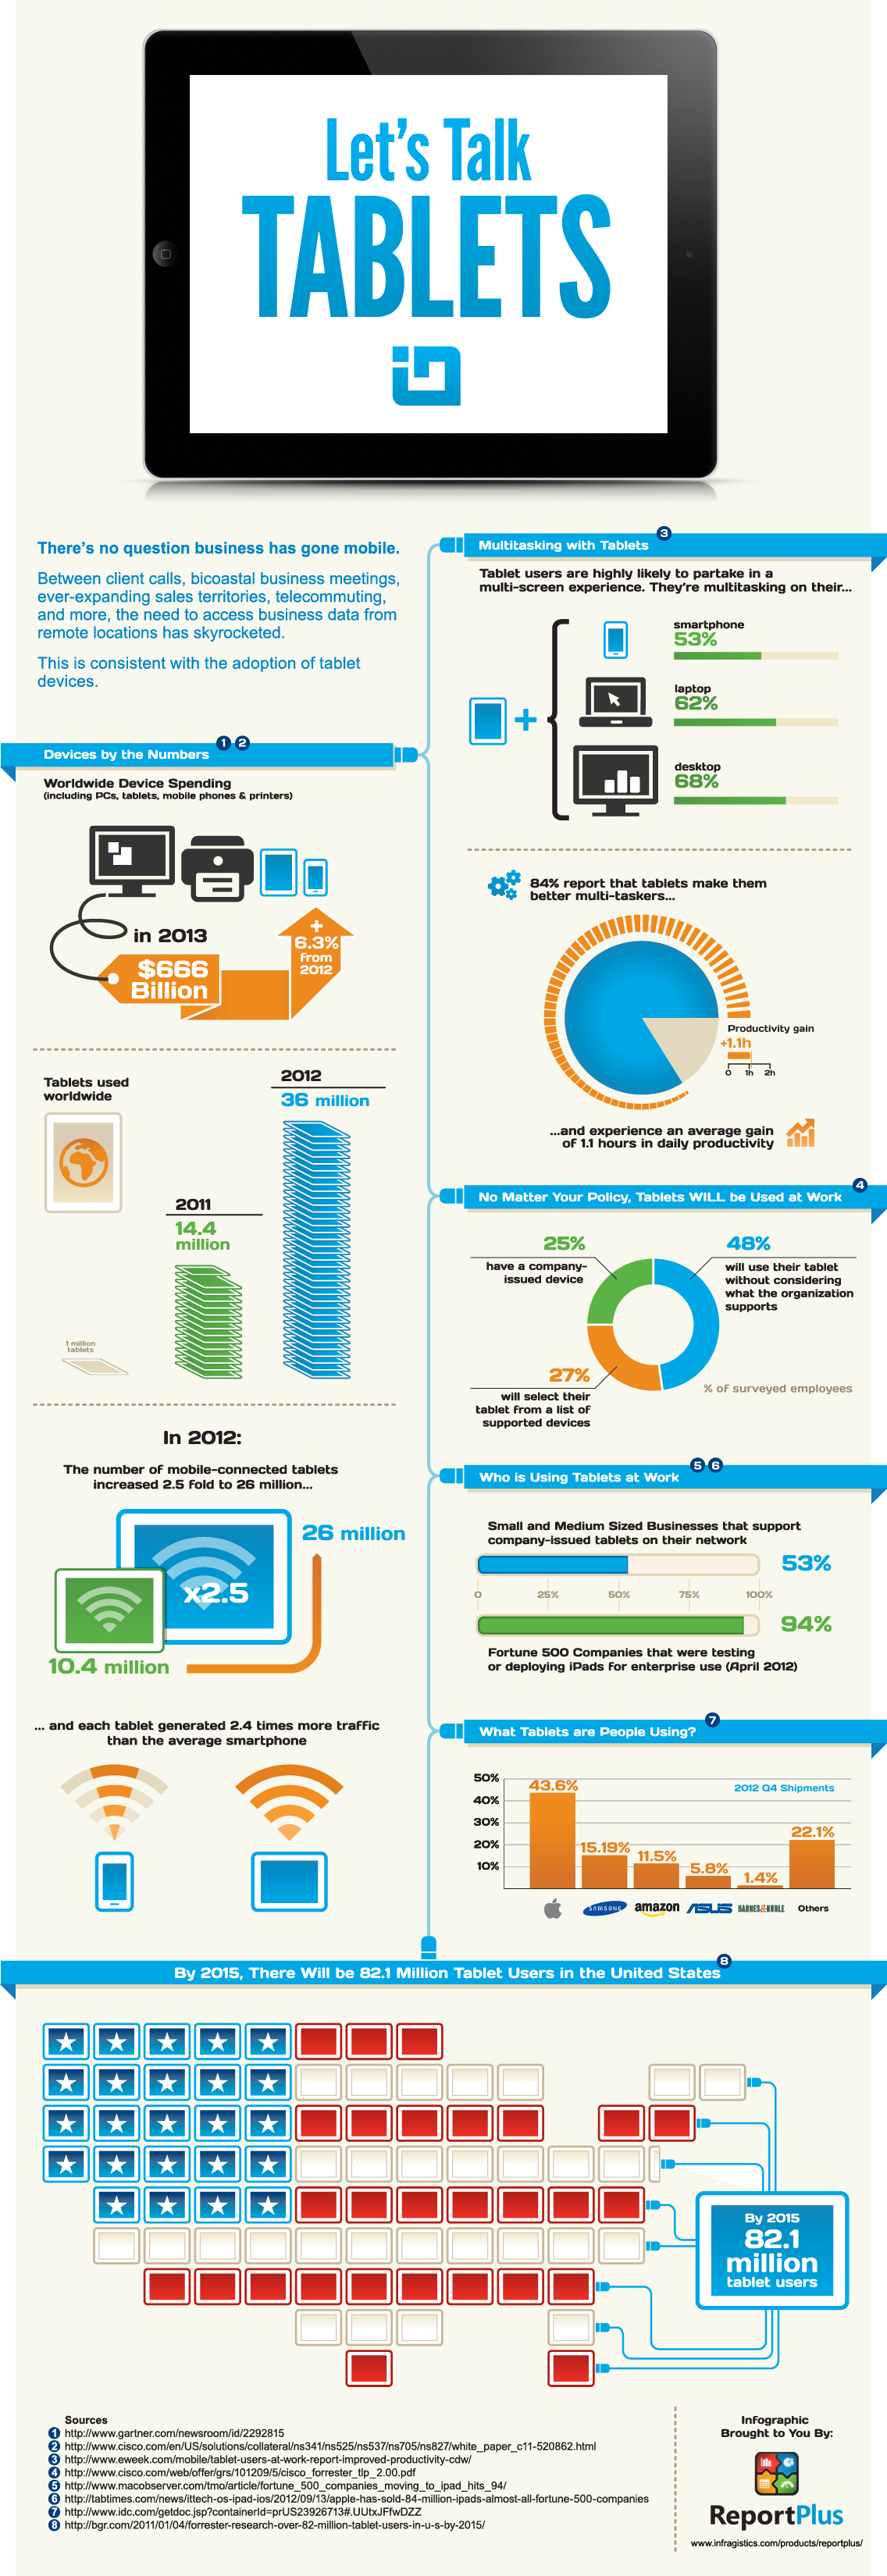
Data Analysis is becoming a hot button requirement for seemingly every facet of organizations today. How are users reviewing and consuming their Data? How do they work most effectively? Check out this Infographic for a quick and easy breakdown.
For more information Download our WhitePaper to find out how ReportPlus fosters self-service BI from your tablet. Download Now!
Tablet Devices and Self-Service Mobile BI Infographic by ReportPlus: Infragistics Mobile Business Apps
Spread the Word:
You can embed a this Infographic on your blog or website. Simply copy the below code and paste it into your website.
<p><a href="http://www.infragistics.com/community/blogs/marketing/archive/2013/04/08/infographic-tablet-devices-and-self-service-mobile-bi-featuring-reportplus.aspx"><img src="http://users.infragistics.com/marketing/images/infographic_tablet.jpg" border="0" alt="BYOD" /></a></p>
<p><a href="http://www.infragistics.com/products/reportplus/">Tablet Devices and Self-Service Mobile BI</a> Infographic by<a href="http://www.infragistics.com/products/reportplus/"> ReportPlus</a> Infragistics Mobile Business Apps</p>

