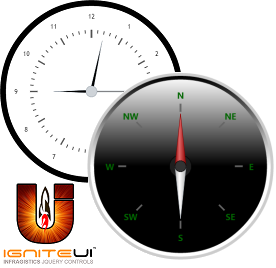
 In the ”Getting started with jQuery Radial Gauge control” blog we examined the basic features of the Ignite UI Radial Gauge and we saw how to create a fully-functional gauge. In this blog we are going to take a look at some tips and tricks for using the gauge in more advanced scenarios and we are going to create a clock and a compass samples to demonstrate how to make multiple needles, multiple outlines and use gradients.
Multiple Needles
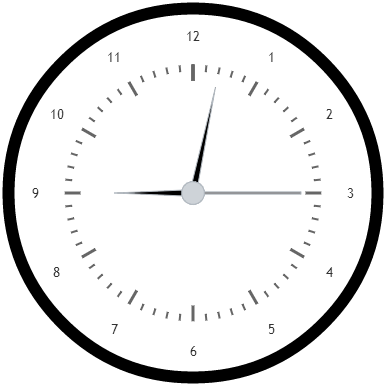
The radial gauge doesn’t yet support multiple needles, so to accomplish such effect for your application you should create few gauges and place them one over another. For example in the clock sample we need three needles- for the minutes, the seconds and the hours. This means we need to build three separate gauges.We don’t need all of the properties and functionalities to be repeated in every gauge, we should style only one of them and make the others transparent. The Labels can’t be transparent so to make them invisible in the transparent gauges we can use the formatLabel event. The result should be a control that looks like the one on the example image.
JS: (hours)
- //hours
- $("#hours").igRadialGauge({
- width: "450px",
- height: "450px",
- minimumValue: "0",
- maximumValue: "12",
- scaleStartAngle: "270",
- scaleEndAngle: "630",
- scaleStartExtent: "1",
- scaleEndExtent: "1",
- scaleBrush: "transparent",
- value: hours,
- needleShape: "triangle",
- needleEndWidthRatio: "1",
- needleStartWidthRatio: "0.03",
- needlePointFeatureWidthRatio: "0",
- needlePivotWidthRatio: 0,
- needleBrush: "black",
- needleEndExtent: "0.35",
- needlePivotShape: "circle",
- interval: 1,
- labelExtent: "0.70",
- labelInterval: 1,
- duplicateLabelOmissionStrategy: "omitFirst",
- backingOutline: "black",
- minorTickCount: 4
- });
JS: (seconds and minutes have similar configuration)
- //seconds
- $("#seconds").igRadialGauge({
- width: "450px",
- height: "450px",
- minimumValue: "0",
- maximumValue: "60",
- scaleStartAngle: "270",
- scaleEndAngle: "630",
- value: newSeconds,
- needleShape: "rectangle",
- needleEndWidthRatio: "0",
- needleStartWidthRatio: "0.01",
- needlePivotWidthRatio: 0,
- needleBrush: "grey",
- interval: 0,
- scaleBrush: "transparent",
- backingOutline: "transparent",
- backingBrush: "transparent",
- formatLabel: function (evt, ui) { ui.label = ""; }
- });
Example image:
To make the clock work of course we should change the value for the different needles at the appropriate time. This can be done easily, we just need to set initial values at the beginning and then change them respectively to the time.
- var interval = setInterval(timer, 1000),
- time = new Date(),
- hours = time.getHours(),
- minute = time.getMinutes(),
- newSeconds = time.getSeconds(),
- secGauge = $("#seconds");
- function timer() {
- var newTime = new Date();
- newSeconds = newTime.getSeconds();
- secGauge.igRadialGauge("option", "value", newSeconds);
- var newMin = newTime.getMinutes();
- var newHours = newTime.getHours();
- if (newMin != minute) {
- minute = newMin;
- $("#minutes").igRadialGauge("option", "value", minute);
- }
- if (newHours != hours) {
- hours = newHours;
- $("#hours").igRadialGauge("option", "value", hours);
- }
- }
Simple as that we now have a functional clock displaying the local time.
Gradients
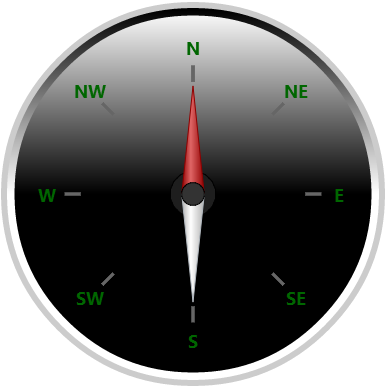
Multiple needles are also useful for our second sample, but in addition to them we want to make the compass have three-dimensional appearance. To accomplish such effect we are going to use gradients as the brushes for different elements. Although you can see in the API documentation that only rangeBrush and rangeOutlines support CSS and gradients, actually all of the properties that are responsible for coloring the different elements of the gauge support them. If you are going to use rangeBrush and rangeOutlines you should first define a range. A range highlights a set of continuous values bound by a specified minimum and maximum value on a gauge scale. You can add multiple ranges to a scale, specifying different brushes, along with starting and ending values. The range has a counterclockwise orientation. Every property that can be used to color the different elements can a CSS string as well as JavaScript objects defining gradients.. The default gradient orientation is top to bottom, so the color at offset 0 will be positioned at the top of the figure and the color at offset 1 will be at the bottom. To change that direction , you should specify the start and the end points.Both the x- and y- axis coordinates for these points must be in the range 0÷1 where (0, 0) is the top-left corner of a figure’s bounds rectangle and (1, 1) is the bottom-right corner. In order to visualize it easily take a look at the following diagram. You can find more detailed information in the “Using Gradient Colors in Data Visualizations” topic of the documentation.
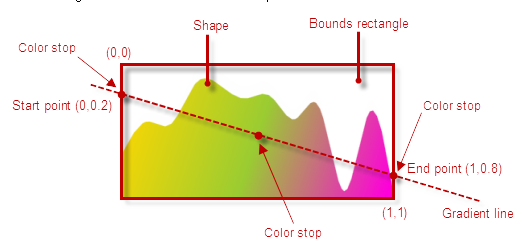
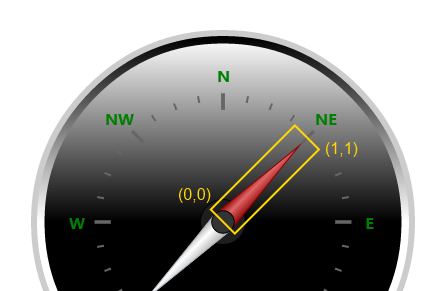
As we mentioned these are not the only properties that support gradients. You can set gradients to the background, the needle, the scale, the outlines and even to the major and minor tick marks and every element has its own diagram like the one above. The diagram depends on the element orientation and is rotates along with it. For example when the needle is at 45 degrees the diagram will also be rotated by as much, you can visualize it like this:
Example Image:
JS:
- needleBrush: {
- type: "linearGradient",
- colorStops: [{
- color: "#8F0000",
- offset: 0
- },
- {
- color: "#E06666",
- offset: 0.4
- }, {
- color: "#8F0000",
- offset: 1
- }]
- }
Apart from the needle in the sample we use gradients for the background and the outlines.
JS:
- backingBrush: {
- type: "linearGradient",
- colorStops: [{
- color: "#fff",
- offset: 0
- },
- {
- color: "#000",
- offset: 1
- }],
- startPoint: { x: 0.5, y: 0 },
- endPoint: { x: 0.5, y: 1 }
- },
- backingOutline: {
- type: "linearGradient",
- colorStops: [{
- color: "#000",
- offset: 0
- },
- {
- color: "#fff",
- offset: 1
- }],
- startPoint: { x: 0.5, y: 0 },
- endPoint: { x: 0.5, y: 1 }
- }
Example image:
Finishing touches
The labelformat event comes in handy, because we need to replace the numeric labels with strings showing the direction.
- formatLabel: function (evt, ui) {
- var labels = ["N", "NE", "E", "SE", "S", "SW", "W", "NW"];
- ui.label = labels[ui.value / 45];
- }
The 3D effect of the outlines is accomplished by using the backing outline of both of the gauges. We set to the backingOutline property of the main gauge an array of brushes as we have shown earlier and we manipulate the outline of the second gauge by increasing its thickness and outer extent.
- backingStrokeThickness: 6,
- backingOuterExtent:0.84
When the design of the gauge is ready we should take care of its functionality. The contemporary mobile devices are capable of determining their orientation.In order to do that we will use the JavaScript DeviceOrientationEvent to handle orientation information. All you need to do to start receiving orientation changes is to listen to that event. We need to catch the changes when we rotate the device around the Z axis and for that reason we need the DeviceOrientationEvent.alpha value, which is represented in degrees with values ranging from 0 to 360 degrees. In the event handler function we need to set the value of one of the needle equal to the alpha value and the other needle should point the opposite direction – alpha+180 degrees.
- if (window.DeviceOrientationEvent) {
- window.addEventListener('deviceorientation', function (eventData) {
- var dir = eventData.alpha;
- deviceOrientationHandler(dir);
- }, false);
- }
- function deviceOrientationHandler(alpha) {
- $("#gauge").igRadialGauge("option", "value", alpha);
- $("#gauge1").igRadialGauge("option", "value", alpha + 180);
- }
The end
There are many ways to use the Ignite UI Radial Gauge control and create a handy and pretty applications. By placing one gauge over another you can have multiple elements like needles, labels, outlines and etc. . You can customize the control by using gradients for the different elements and that way you can have a unique gauge that will visualize your data.
You can see a live demo of the compass and the clock in jsFiddle or download the ASP.NET MVC project with the samples.
You can follow us on Twitter @Infragistics and stay in touch on Facebook, Google+ and LinkedIn!
