The Infragistics packages for WPF and Silverlight contain a lot of diverse charts for data visualization. The control that we are going to look at is The Doughnut Chart. This chart supports one or more rings surrounding a blank center. It can be customized by controlling the slices labels and colors or by configuring the inner radius. In this blog you can learn how to add this control to your application and how to create a custom hierarchical chart by using multiple rings.
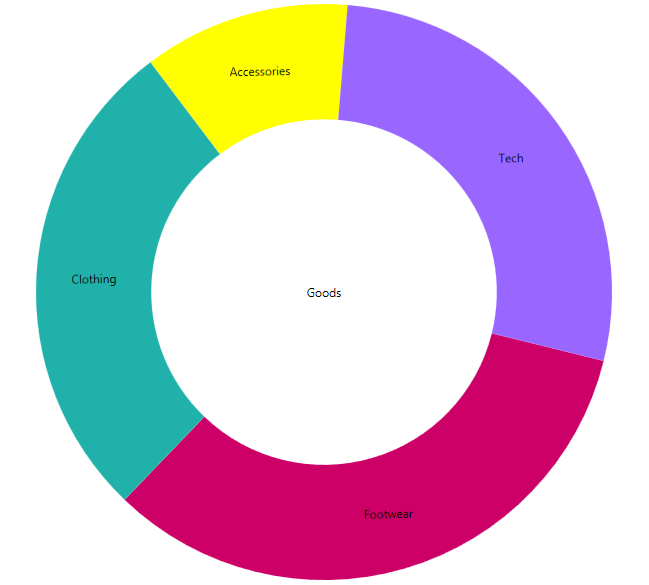
Adding the Doughnut Chart
Generally, when you create your WPF project the first thing you need to do is to add the references. There is an easy way to do that:
- Go to the toolbox. There you will see the NetAdvantage WPF and Shared XAML controls.
- Drag and drop the “XamDoughnutChart”.
When you do those steps you will see that Visual Studio automatically adds the required Infragistics references.

When you dragged “XamDoughnutChart”, you actually created the needed tag to host our chart. The next step is to include the following code:
- <ig:XamDoughnutChart x:Name="slice">
- <ig:XamDoughnutChart.Series>
- <ig:RingSeries
- LabelMemberPath="Label"
- ValueMemberPath="productionShare"
- LabelsPosition="BestFit"
- ItemsSource="{Binding Mode=OneWay, Source={StaticResource source}}">
- </ig:RingSeries>
- </ig:XamDoughnutChart.Series>
- </ig:XamDoughnutChart>
The data source for the items is generated in the cs file of the page as follows:
- publicclassCategory
- {
- publicstring Label { get; set; }
- publicdouble productionShare { get; set; }
- }
- publicclassHierarchalDataCollection : List<Category>
- {
- public HierarchalDataCollection()
- {
- this.Add(newCategory { Label = "Footwear", productionShare = 46 });
- this.Add(newCategory { Label = "Clothing", productionShare = 38 });
- this.Add(newCategory { Label = "Accessories", productionShare = 16 });
- }
- }
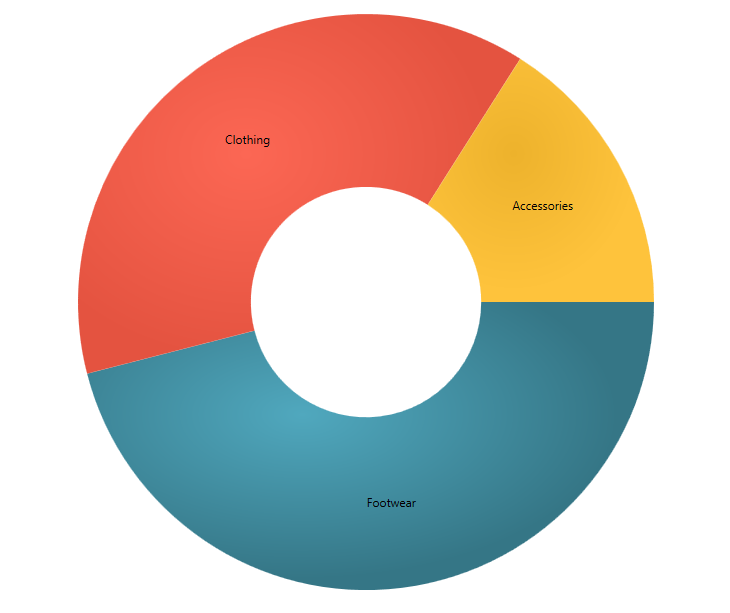
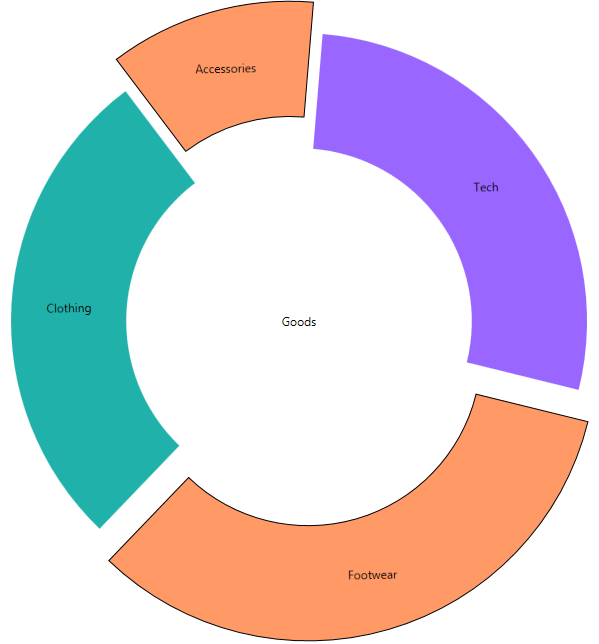
Basically those are the steps to create a Doughnut Chart. Of course it has many options like legend, brush, slice Select and Slice Explode, which will make your chart even more attractive. More about the options you can find in the documentation. I will just give you a hint how to add a particular option. For example if you want to be able to select a slice and thus make it explode and change its style add the AllowSliceExplosion and AllowSliceSelection options and set their values to true. Then create a slice click event like that:
XAML:
- AllowSliceExplosion="True"
- AllowSliceSelection="True"
- SliceClick="slice_SliceClick"
C#:
- privatevoid slice_SliceClick(object sender, Infragistics.Controls.Charts.SliceClickEventArgs e)
- {
- e.IsSelected = !e.IsSelected;
- e.IsExploded = !e.IsExploded;
- }
Custom hierarchical chart
When you need to visualize hierarchical data, you can use the multiple ring visualization of the chart. We are going to create three rings doughnut chart, which will display the main categories broken down into subcategories. For that purpose we are going to create three series and define our data source like this:
XAML :
- <ig:XamDoughnutChart.Series>
- <ig:RingSeries
- StartAngle="30"
- LabelMemberPath="Label"
- ValueMemberPath="productionShare"
- LabelsPosition="BestFit"
- ItemsSource="{Binding Mode=OneWay, Source={StaticResource source}}"
- Loaded="RingSeries_Loaded">
- </ig:RingSeries>
- <ig:RingSeries
- StartAngle="30"
- LabelMemberPath="Label"
- ValueMemberPath="productionShare"
- LabelsPosition="BestFit"
- Loaded="RingSeries_Loaded"
- OthersCategoryThreshold="0" >
- </ig:RingSeries>
- <ig:RingSeries
- StartAngle="30"
- LabelMemberPath="Label"
- ValueMemberPath="productionShare"
- LabelsPosition="BestFit"
- OthersCategoryThreshold="0">
- </ig:RingSeries>
- </ig:XamDoughnutChart.Series>
C# :
- publicclassHierarchalDataCollection : List<Category>
- {
- public HierarchalDataCollection()
- {
- this.Add(newCategory { Label = "Footwear"});
- this.Add(newCategory { Label = "Clothing"});
- this.Add(newCategory { Label = "Accessories"});
- this.Add(newCategory { Label = "Tech" });
- this[0].Children.Add(newCategory { Label = "Boots" });
- this[0].Children.Add(newCategory { Label = "Shoes" });
- this[0].Children.Add(newCategory { Label = "Sneakers" });
- this[0].Children.Add(newCategory { Label = "Slippers" });
- this[1].Children.Add(newCategory { Label = "Dresses" });
- this[1].Children.Add(newCategory { Label = "T-shirts" });
- this[1].Children.Add(newCategory { Label = "Shirts" });
- this[1].Children.Add(newCategory { Label = "Pants" });
- this[2].Children.Add(newCategory { Label = "Bag" });
- this[2].Children.Add(newCategory { Label = "Jewelry" });
- this[2].Children.Add(newCategory { Label = "Scarf" });
- this[3].Children.Add(newCategory { Label = "PC"});
- this[3].Children.Add(newCategory { Label = "Laptops"});
- this[3].Children.Add(newCategory { Label = "Tablets"});
- this[3].Children.Add(newCategory { Label = "Phones"});
- this[0].Children[0].Children.Add(newCategory { Label = "B1", productionShare = 3 });
- this[0].Children[0].Children.Add(newCategory { Label = "B3", productionShare = 3 });
- this[0].Children[0].Children.Add(newCategory { Label = "B4", productionShare = 4 });
- this[0].Children[1].Children.Add(newCategory { Label = "S1", productionShare = 3 });
- this[0].Children[1].Children.Add(newCategory { Label = "S2", productionShare = 5 });
- this[0].Children[1].Children.Add(newCategory { Label = "S3", productionShare = 4 });
- this[0].Children[2].Children.Add(newCategory { Label = "Sn1", productionShare = 6 });
- this[0].Children[2].Children.Add(newCategory { Label = "Sn2", productionShare = 9 });
- this[0].Children[3].Children.Add(newCategory { Label = "SL1", productionShare = 2 });
- this[0].Children[3].Children.Add(newCategory { Label = "Sl2", productionShare = 4 });
- this[0].Children[3].Children.Add(newCategory { Label = "Sl3", productionShare = 3 });
- this[1].Children[0].Children.Add(newCategory { Label = "d1", productionShare = 3 });
- this[1].Children[0].Children.Add(newCategory { Label = "d2", productionShare = 3 });
- this[1].Children[0].Children.Add(newCategory { Label = "d3", productionShare = 2 });
- this[1].Children[1].Children.Add(newCategory { Label = "t1", productionShare = 5 });
- this[1].Children[1].Children.Add(newCategory { Label = "t2", productionShare = 4 });
- this[1].Children[1].Children.Add(newCategory { Label = "t3", productionShare = 2 });
- this[1].Children[1].Children.Add(newCategory { Label = "t4", productionShare = 1 });
- this[1].Children[2].Children.Add(newCategory { Label = "sh1", productionShare = 3 });
- this[1].Children[2].Children.Add(newCategory { Label = "sh2", productionShare = 3 });
- this[1].Children[2].Children.Add(newCategory { Label = "sh3", productionShare = 2 });
- this[1].Children[3].Children.Add(newCategory { Label = "p1", productionShare = 4 });
- this[1].Children[3].Children.Add(newCategory { Label = "p2", productionShare = 6 });
- this[2].Children[0].Children.Add(newCategory { Label = "bag1", productionShare = 2 });
- this[2].Children[0].Children.Add(newCategory { Label = "bag2", productionShare = 1 });
- this[2].Children[0].Children.Add(newCategory { Label = "bag3", productionShare = 4 });
- this[2].Children[1].Children.Add(newCategory { Label = "j1", productionShare = 3 });
- this[2].Children[1].Children.Add(newCategory { Label = "j2", productionShare = 2 });
- this[2].Children[2].Children.Add(newCategory { Label = "sc1", productionShare = 1 });
- this[2].Children[2].Children.Add(newCategory { Label = "sc2", productionShare = 1 });
- this[2].Children[2].Children.Add(newCategory { Label = "sc3", productionShare = 1 });
- this[2].Children[2].Children.Add(newCategory { Label = "sc4", productionShare = 1 });
- this[3].Children[0].Children.Add(newCategory { Label = "pc1", productionShare = 3 });
- this[3].Children[0].Children.Add(newCategory { Label = "pc2", productionShare = 2 });
- this[3].Children[0].Children.Add(newCategory { Label = "pc3", productionShare = 5 });
- this[3].Children[1].Children.Add(newCategory { Label = "l1", productionShare = 4 });
- this[3].Children[1].Children.Add(newCategory { Label = "l2", productionShare = 3 });
- this[3].Children[2].Children.Add(newCategory { Label = "tab1", productionShare = 4 });
- this[3].Children[2].Children.Add(newCategory { Label = "tab2", productionShare = 3 });
- this[3].Children[2].Children.Add(newCategory { Label = "tab3", productionShare = 3 });
- this[3].Children[2].Children.Add(newCategory { Label = "tab4", productionShare = 3 });
- this[3].Children[3].Children.Add(newCategory { Label = "ph1", productionShare = 2 });
- this[3].Children[3].Children.Add(newCategory { Label = "ph2", productionShare = 3 });
- this[3].Children[3].Children.Add(newCategory { Label = "ph3", productionShare = 2 });
- this[3].Children[3].Children.Add(newCategory { Label = "ph4", productionShare = 1 });
- }
- }
Now we have all of the data that we want to visualize. As we are making it look hierarchical it would be nice if the different slices for every category have similar color. What we are going to do is take the basic brush from the innermost ring and lighten it with every step. In the following code you can see that first we figure out how many children does the ring have and then we create a collection of brushes that will be a perfect match for the children.
- privatevoid RingSeries_Loaded(object sender, RoutedEventArgs e)
- {
- var ringSeries = (sender asRingSeries);
- var count = ringSeries.Ring.ArcItems[0].SliceItems.Count();
- var brushes = ringSeries.Brushes;
- BrushCollection brushesMatch = newBrushCollection();
- for (var i = 0; i < count; i++)
- {
- var childrenCount = (ringSeries.ItemsSource asList<Category>)[i].Children.Count();
- var child = (ringSeries.ItemsSource asList<Category>)[i].Children;
- var brush = brushes[i];
- for (var j = 0; j < childrenCount; j++)
- {
- double step = 1 / (double)childrenCount;
- Random rand = newRandom();
- double val = (1 + j) * step - .3;
- brushesMatch.Add(brush.GetLightened(val));
- }
- }
- ringSeries.Chart.Series[ringSeries.Ring.Index + 1].Brushes = brushesMatch;
- }
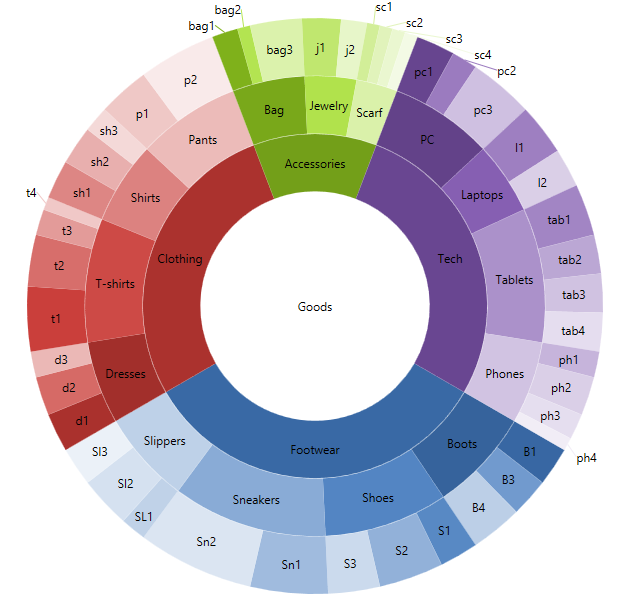
Depending on the data you are going to display, you can change the way the children are colored, for instance you can brush them in random tint. No matter what kind of brush you use- Solid, Radial or Linear Gradient the GetLightend extension method will handle it.
- privatevoid RingSeries_Loaded(object sender, RoutedEventArgs e)
- {
- var ringSeries = (sender asRingSeries);
- var count = ringSeries.Ring.ArcItems[0].SliceItems.Count();
- var brushes = ringSeries.Brushes;
- BrushCollection brushesMatch = newBrushCollection();
- for (var i = 0; i < count; i++)
- {
- var childrenCount = (ringSeries.ItemsSource asList<Category>)[i].Children.Count();
- var child = (ringSeries.ItemsSource asList<Category>)[i].Children;
- var brush = brushes[i];
- for (var j = 0; j < childrenCount; j++)
- {
- Random rand = newRandom();
- if (j % 2 == 0)
- {
- double val = Math.Round((rand.NextDouble() / 4), 2);
- brushesMatch.Add(brush.GetLightened(-val));
- }
- else
- {
- double val = Math.Round((rand.NextDouble() / 3), 2) + 0.2;
- brushesMatch.Add(brush.GetLightened(val));
- }
- }
- }
- ringSeries.Chart.Series[ringSeries.Ring.Index + 1].Brushes = brushesMatch;
- }
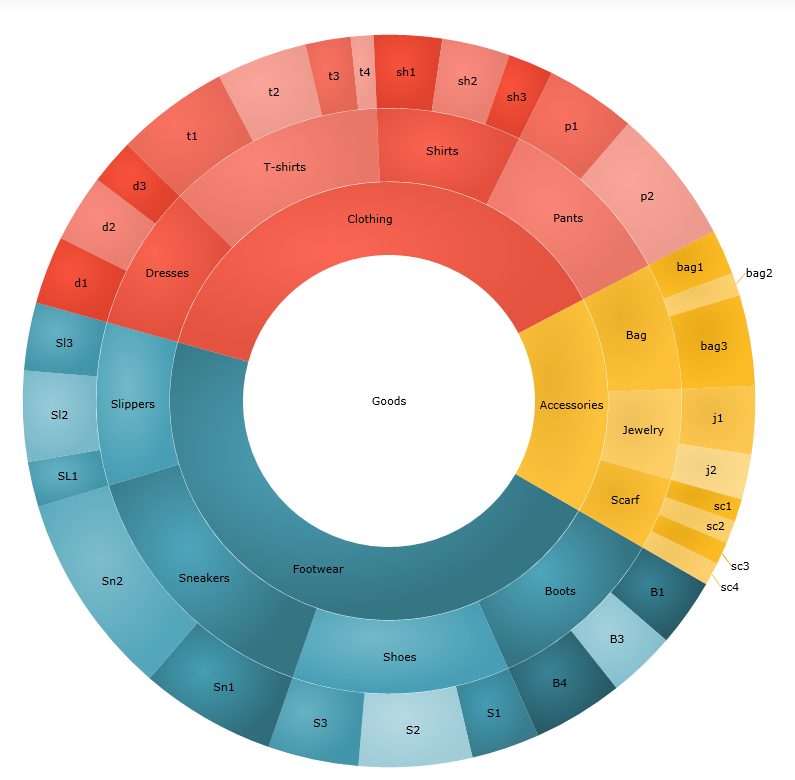
If you want to learn more about the doughnut chart you can check out the product’s page or read my blog:”The Ignite UI Doughnut Chart and its features”.
A WPF sample and Silverlight sample.
You can follow us on Twitter @Infragistics and stay in touch on Facebook, Google+ and LinkedIn!