The vast majority line of business application rely on grids for showing record data. In your WPF applications, you can find the XamDataGrid (a part of NetAdvantage for WPF) especially useful for showing such data – it is a high-performance, fully-featured, richly stylable control. In many cases, the data you need to display is changing, showing the user an up-to-date status on a measurement value on a piece of equipment, a price on a stock, or the efficiency of an engine during a test. When a user makes a decision on whether to look more closely at a certain record in the grid, they need not only the latest value, but also the history of values to let them see the trend of the latest data. They’d like to know whether the trend is going up or down, or how often the values are outside of a given range. This is the kind of information that can only be displayed in a sparkline control.
This blogpost describes how you can add a XamSparkline control (WPF, Silverlight) to a WPF XamDataGrid column for a quick visualization of recent changes in the column values. This same functionality is available as standard using the XamGrid (available for both WPF and Silverlight), and is shown in this sample. Please download the sample project – it illustrates how to declare and bind a column to show the history of column value changes in a XamDataGrid. Please remember to unblock the ZIP archive before extracting it. The project is built using Visual Studio 2010 and .NET Framework 4. It uses a pre-release of the 12.2 WPF product, so you can build and run it without any additional downloads. Fully-functional free 30-day trial of the NetAdvantage for WPF product, which includes the XamDataGrid is available.
Keeping track of value history
You can easily enable the XamDataGrid to keep track of data value changes using the approach described here. This approach uses the DataValueChangedNotificationsActive, DataValueChangedHistoryLimit, and DataValueChangedScope properties. In the specific case, we’re tracking the last 15 values for columns ColumnC and ColumnD. These columns are set up as shown below:
<Style x:Key="graphingCVPStyle"
        TargetType="{x:Type igDP:CellValuePresenter}">
    <Setter Property="Height" Value="25" />
    <Setter Property="Template">
        <Setter.Value>
            <ControlTemplate TargetType="{x:Type igDP:CellValuePresenter}">
                <Border Height="{TemplateBinding Height}">
                    <Grid>
                        <Grid.ColumnDefinitions>
                            <ColumnDefinition Width="Auto" />
                            <ColumnDefinition Width="*" />
                        </Grid.ColumnDefinitions>
                        <TextBlock Grid.Column="0" VerticalAlignment="Center"
                            Text="{Binding Value, RelativeSource={RelativeSource TemplatedParent}}" />
                        <ig:XamSparkline Grid.Column="1"
                                ItemsSource="{Binding ValueHistory, RelativeSource={RelativeSource TemplatedParent}}"
                                ValueMemberPath="Value"
                                DisplayType="Line"
                                Width="80"
                                LineThickness="1" />
                    </Grid>
                </Border>
            </ControlTemplate>
        </Setter.Value>
    </Setter>
</Style>
The DataValueChangedScope property is set to a value of AllAllocatedRecords so the XamDataGrid keeps history for rows which are allocated, but aren’t currently visible. In order to have history kept for invisible records, we need to make sure the XamDataGrid instantiates records to represent all the records in the data source by setting the RecordLoadMode property to PreloadRecords. So this creates XamDataGrid rows for the entire dataset and keeps the data value changes for each cell in the ColumnC and ColumnD columns. This approach increases the memory footprint of our sample, because we’re no longer virtualizing the UI elements of the XamDataGrid. This is why I recommend using the PreloadRecords setting for the RecordLoadMode for relatively small datasets. I would suggest you try to strike a balance between what the user would like to have, and the size of the memory footprint required.
Visualizing value changes with XamSparkline
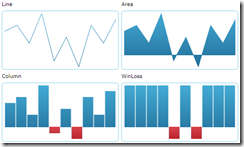
We’ll now have a XamSparkline (available for both Silverlight and WPF) added to the CellValuePresenter of the columns to display the value history for each cell in the ColumnC and ColumnD columns. The XamSparkline presents values in a small chart, where the goal is to show the values and richly format them, to give the user information about the trend and outliers, rather than a lot of interactivity (which is where a XamDataChart is more useful). Here’s are a few sample XamSparklines from our online samples:
We’ll retemplate the cell to show the latest value next to a XamSparkline showing all the historic values for the cell. We’ll declare the template as shown below:
<Style x:Key="graphingCVPStyle"
    TargetType="{x:Type igDP:CellValuePresenter}">
    <Setter Property="Height" Value="25" />
    <Setter Property="Template">
        <Setter.Value>
            <ControlTemplate TargetType="{x:Type igDP:CellValuePresenter}">
                <Border Height="{TemplateBinding Height}">
                    <Grid>
                        <Grid.ColumnDefinitions>
                            <ColumnDefinition Width="Auto" />
                            <ColumnDefinition Width="*" />
                        </Grid.ColumnDefinitions>
                        <TextBlock Grid.Column="0" VerticalAlignment="Center"
                            Text="{Binding Value, RelativeSource={RelativeSource TemplatedParent}}" />
                        <ig:XamSparkline Grid.Column="1"
                                ItemsSource="{Binding ValueHistory, RelativeSource={RelativeSource TemplatedParent}}"
                                ValueMemberPath="Value"
                                DisplayType="Line"
                                Width="80"
                                LineThickness="1" />
                    </Grid>
                </Border>
            </ControlTemplate>
        </Setter.Value>
    </Setter>
</Style>
Please note the binding expressions for the TextBlock and XamSparkline controls. We’ve set a Width of 80 to comfortably show the 15 values, and we’re using a line to display the values in the XamSparkline, but you can set it to any of the other markers supported – area, column, WinLoss (sample). You can also add trendlines, highlight ranges and tooltips, as described in this walkthrough.
Having declared the template we’ll use for columns we’d like to have a sparkline in, we need to reference the style in the declarations of these columns – please note the reference to the static resource when setting the CellValuePresenterStyle.
<igDP:Field Name="ColumnD" Width="150">
  <igDP:Field.Settings>
      <igDP:FieldSettings
        DataValueChangedHistoryLimit="15"
        DataValueChangedScope="AllAllocatedRecords"
        CellValuePresenterStyle="{StaticResource graphingCVPStyle}"
        DataValueChangedNotificationsActive="True"/>
  </igDP:Field.Settings>
</igDP:Field>
Summary
In this blog post I demonstrated how to setup the XamDataGrid to track history changes and visualize them into a XamSparkline. This approach can readily be used to add context to your data, and enable your users to make better decisions based on a concise and rich presentation of data. You can add this enhanced presentation to grids in your applications where a user would benefit from seeing a history of value changes. Of course, you can customize the XamSparkline to visualize this data in a way to properly format and display its context, so that it can be easily understood by the user.
If you have any questions or comments, you can reach me at kmatev@infragistics.com


