Introduction
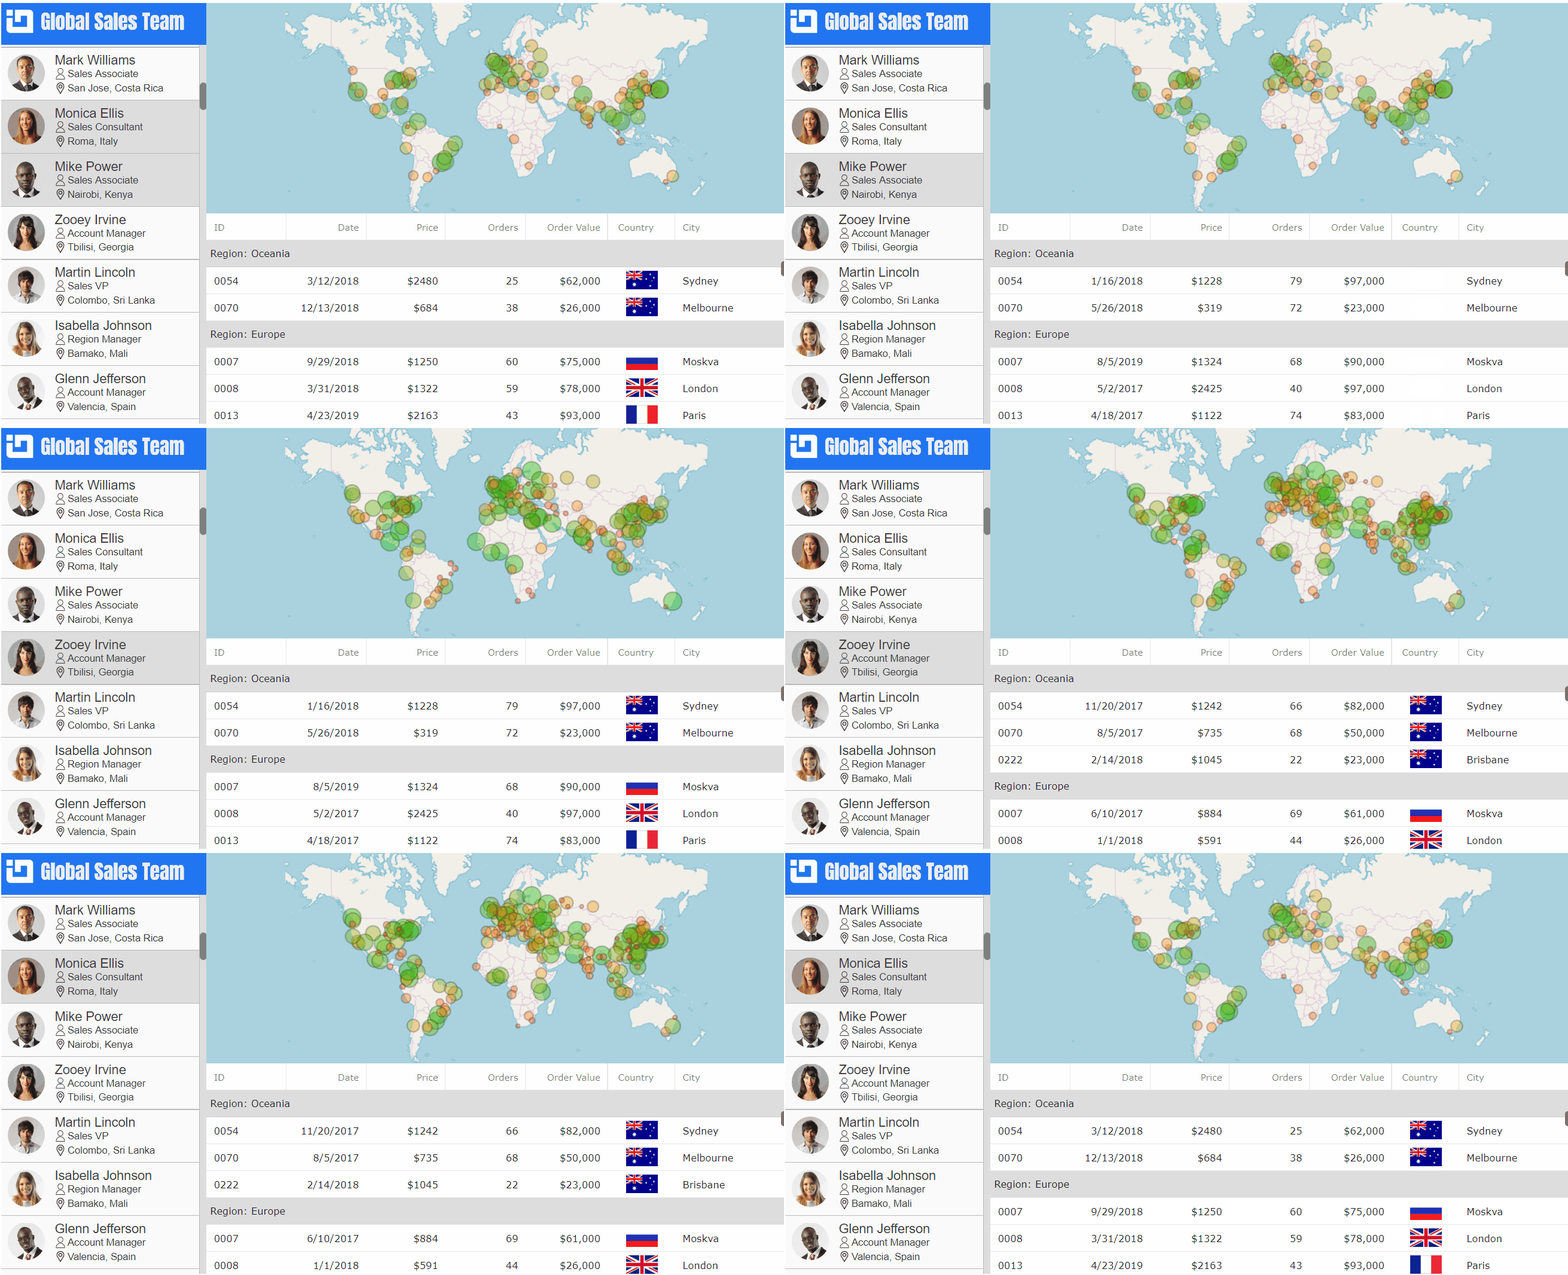
Have you ever wanted to create a master-detail application or learn how to visualize a large data source with subsets data items? If so, this blog post will show you how to create an application that will visualize the Global Sales Team in a list of people, locations of sales in for React IgrGeographicMap component, and sales details in React IgrLiveGrid component.

Note that the above animation does not represent actual app, where the map and grid components are updated very fast with new data for selected person in sales team.
Master-Detail view design is a great data visualization pattern for presenting large and complex data sets. As the name suggests, Master-Detail design consists of two views: master view and detail view. The master view is usually a selectable list of items such as customers, team members, products. The detail view displays data for the currently selected item in the master view.
Master-View
The master view is built using standard div, span, img, and label components.

However, first we need to generate data source for our application and create an array of items to display in the master view.
import DataUtil from"../data/DataUtil";

// declaring fields in a class:
public salesPeople: any[];
public salesData: any[];
public salesList: JSX.Element[] = [];

// generating data and items:
constructor(props: any) {
    super(props);
    this.salesPeople = DataUtil.getEmployees(100);
    this.salesList = [];
    for (let i = 0; i < this.salesPeople.length; i++) {
        const person =  this.salesPeople[i];
        this.salesList.push(this.renderItem(person, i));
    }
}
Next, we can create the master view and render each item of sales list as it is demonstrated below.
<divclassName="masterView">
    <divclassName="masterHeader">
        <imgsrc={this.getHeaderIcon()}/>
        <label>World Sales Team</label>
    </div>
    <divclassName="masterList">
        <div>{this.salesList}</div>
    </div>
</div>
Detail-View
The detail view contains of a map and a grid components that are part of Ignite Ui for React and you can try them for free.
<divclassName="detailView">
    <divclassName="map"></div>
    <divclassName="grid"></div>
</div>

The IgrGeographicMap allows you to display data that contains geographic locations from your data on geographic imagery maps.
<divclassName="detailView">
    <divclassName="map">
        <IgrGeographicMap
            ref={this.onMapRef}
            width="100%"
            height="100%"
            zoomable="true">
            <IgrGeographicProportionalSymbolSeries
            name="sales"
            radiusScale={this.sizeScale}
            fillScale={this.fillScale}
            fillMemberPath="OrderValue"
            radiusMemberPath="OrderValue"
            latitudeMemberPath="Lat"
            longitudeMemberPath="Lon"
            markerOutline="rgba(0,0,0,0.2)"
            markerType="Circle"
            tooltipTemplate={this.onSeriesTooltipCreate}  />
        </IgrGeographicMap>
    </div>
</div>

The IgrLiveGrid is a tabular React component that allows you to quickly bind and display your data with little coding or configuration. Features of the React data grid include filtering, sorting, templates, row selection, row grouping, row pinning and movable column.
<divclassName="detailView">
    <divclassName="grid">
        <IgrLiveGrid
            ref={this.onGridRef}
            height="100%"
            width="100%"
            rowHeight="35"
            headerHeight="35"
            autoGenerateColumns="false">
            <IgrTextColumnpropertyPath="ID"width="*>70"/>
            <IgrDateTimeColumnpropertyPath="OrderDate"
            headerText="Date"width="*>100"horizontalAlignment="right" />
            <IgrNumericColumnpropertyPath="OrderPrice"
            headerText="Price"width="*>90"positivePrefix="$"maxFractionDigits="0"/>
            <IgrNumericColumnpropertyPath="OrderCount"
            headerText="Orders"width="*>80"/>
            <IgrNumericColumnpropertyPath="OrderValue"
            headerText="Order Value"width="*>110"positivePrefix="$" />
            <IgrImageColumnpropertyPath="CountryFlag"
            headerText="Country"horizontalAlignment="center"width="90"/>
            <IgrTextColumnpropertyPath="City"width="*>150"/>
        </IgrLiveGrid>
    </div>
</div>
Binding Views
After creating all views, we can bind them by setting data source in a click event of the master list.
public salesData: any[];

constructor(props: any) {
    super(props);

    this.salesPeople = DataUtil.getEmployees(100);
    // defaulting to first person in the array of sales people
    this.salesData = this.salesPeople[0].Sales;
}

public onGridRef(grid: IgrLiveGrid) {
    this.grid = grid;
    this.grid.dataSource = this.salesData;
    this.grid.flush();
    this.grid.scrollToRowByIndex(0);
}

public onMapRef(map: IgrGeographicMap) {
    this.map = map;
    this.map.dataSource = this.salesData;
    this.map.zoomToGeographic({ left: -120, top: -30, width: 180, height: 90});
}

public onMasterItemClick(event: React.MouseEvent) {
    event.preventDefault();
    const newId = event.currentTarget.id;
    this.salesData = this.salesPeople[newId].Sales;

    this.map.dataSource = this.salesData;
    this.grid.dataSource = this.salesData;
    this.grid.flush();
    this.grid.scrollToRowByIndex(0);
}
Final Thoughts
The above code snippets show the most important elements of implementing a master-detail view in React application that visualizes locations of sales in React IgrGeographicMap component, and sales details in React IgrLiveGrid component.
You can download the full source code for this application from this GitHub repository. I hope you found this blog post interesting and got inspired to create your own master-detail application using the Ignite UI for React components.
Happy coding,
Martin