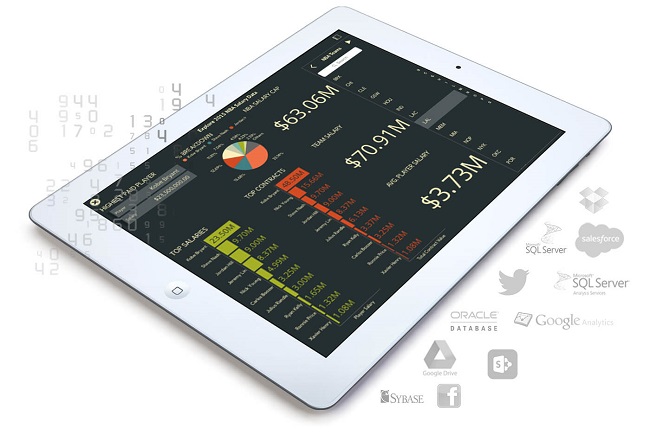
Today, we are creating and consuming more data than ever. In business, in our personal lives, on our desktop, with our multiple mobile devices. In fact, every day we create 2.5 billion gigabytes of data. Big Data is becoming one of the biggest driving forces behind the global economy and is actually supporting economic development in developing countries.
The prediction is that in less than five years, 40 zettabytes of data in the world will exist. For context, three years ago the entire Internet was estimated to hold about 5 billion gigabytes – which is 0.5 of 1 zettabyte. So, that would be an increase from 5 billion to 400 Billion gigabytes.
Of course, these numbers - their sheer size - sitting on your screen, are impossible to really comprehend. Certainly without the help of a visual aid.

Mind your own data business
So, where does your company’s data fit into all this? It’s pretty straightforward, actually. Your Line of Business (LOB) tools are the biggest producer of data for your organization. For example, if your company uses SharePoint or Office 365, it’s likely then that you have a wealth of data concerned with every aspect of your business. The likelihood also is that this data is quite complex and dispersed across your entire LOB infrastructure – which in and of itself can be disjointed.
In today’s post we focus on the key to a winning data-driven strategy, so you can collect all your significant data in a single space and effectively and consistently streamline your visual presentation of that data for better decision making. Get every member of your team ‘in on the ground floor’ with your findings and/or strategies.
Within your SharePoint ecosystem you likely have lots and lots of existing and useful company data:
- Calendars – to schedule meetings, set reminders, help manage your team members
- Employee vacation roster – so you can easily see who has scheduled time off; or who is available for a project at certain time, etc.
- Daily task manager – to provide your busy day with much needed structure
- Document folders – holding a wealth of information and crucial work
- Excel spreadsheets – the inevitable source of massive amounts of data
This, of course, is just the ‘tip of the iceberg’ when it comes to the amount of information you carry within your Line of Business systems. Bear in mind also that a lot of this data is dynamic and ever-changing. So it stands to reason that you should be able to view and display it in a vibrant and active way.
Static data doesn’t ‘excel’
The unfortunate fact is - despite the spike in data volume that we are now creating on a daily basis - the means that most companies use to view their crucial information is as static as simply numbers on a spreadsheet. Microsoft Excel has been a market leader in data management since the mid-eighties but, in the thirty years since, as discussed above, data creation and the volume of data companies are storing, analyzing and using these days has exposed some of the program’s weaknesses.

For instance, after a certain volume of information, an Excel spreadsheet doesn’t scale properly as the complexity of your business task or function increases. It can be cumbersome to share multiple spreadsheets with colleagues and migrating data from other apps and locations into Excel can be slow and tedious. It also fails in its one-dimensional view of graphs, without a drill down function. Graphs in Excel exist only to show results, rather than find patterns and trends.
Data that goes for miles
You should be doing more with all your available data. The key is using the information that you’re creating, that you’re recording, the data that is building up, to help inform your business strategy. If ‘knowledge is power’ then managing your knowledge is the way towards harnessing your power in the most effective way.
When it comes to taking your important information and being able to successfully use it as part of your business strategy you need a great Data Visualization solution. If the question is: what is the key to a winning data-driven strategy? Then, enabling LOB users with self-service data visualizations & data discovery is the answer.
That’s where ReportPlus comes in. ReportPlus can handle an extraordinary amount of data across a wide range of applications and clients. With a Desktop and iOS creator apps, and Android and web viewers, ReportPlus enables you to connect to your data from your SharePoint Sites as well as Office 365, Microsoft Dynamics and many more, and create impressive and dynamic visualizations that you can share with your whole company no matter where your colleagues might be.
Designed for mobile working, with ReportPlus you can quickly view dashboards and reports on any device, so you can interact with your data in the office or on-the-go. The apps and dashboards can also be installed securely On-Premise, for compliance needs, or if you just need extra piece of mind.
The app is a modern Business Intelligence essential for data-driven professionals (and let’s face it, today most of us are). One of the greatest assets of ReportPlus is its self-service design and how simple it is to use. Connect to your data from every source you use - files On-Premises, content in the cloud - and combine it into one dashboard and create compelling data visualizations, without the need for detailed IT knowledge or experience. Used to make faster, smarter decisions by the guys working on the building site as well as the head engineer in charge of the operation, ReportPlus gives us insights in an instant.
To find out the extent of the power of ReportPlus, visit its website and seehow this data visualization solution can be the key to a winning data-driven strategy for your business.